Blog

Insights & ideas

Stay ahead with expert articles, industry trends, and actionable insights to help you grow.

What it used to be and what it has become: visualLabs through my own eyes
10 mins read
Apr 10, 2025

What it used to be and what it has become: visualLabs through my own eyes

I first joined VisualLabs in the summer of 2020 as a junior business analyst. As you can see from the timeline, I was part of the mass junior recruitment. With three of us, the company grew to 8 people at that time.

Read more

I first joined VisualLabs in the summer of 2020 as a junior business analyst. As you can see from the timeline, I was part of the mass junior recruitment. With three of us, the company grew to 8 people at that time.

In the more than 1 year I worked here from 2020-2021, I was involved in quite a variety of tasks: building and improving Power BI reports, working a lot on a contract management application I built using the Power Platform, and also gaining insight into the beauty of Business Central. The latter also gave rise to some comical memories, such as the painstaking work involved in recording and subtitling training videos for clients, and how I was then, as an undergraduate student, on 'duty' for Christmas because I had no more holidays left for the year. But I got a lot of support from my senior colleagues in these things, they didn't let me get lost in the shuffle.

3 years later, in the summer of 2024, I rejoined VL, but now I work specifically with ERP. One thing that was very nice and new to me in the company was the company timeline. Where last time I was one of the mass junior hires, I'm now a part of the company life.

An amazing amount has happened in my time away, and it's great to see these events being shared by my colleagues, creating a stronger sense of belonging.

What has actually changed in these 3 years? I haven't had the chance to go through everything since I rejoined, and there's not enough space to go into it all here, so I'll just give you a few snippets.

Office

The first of these is probably the new office: the move from Zsigmond Square to Montevideo Street was already done when I was still here as a junior. But who I couldn't enjoy it then, and I wasn't part of the "moving in", but still, when I returned here 3 years later, I felt like I had shaped it. Interpret this to mean that the ethos that makes visuallabs to visuallabs, I think, changed very little, and the homeliness of the office reflected that.

Specialisation

The company has made huge progress in terms of specialisation and staff numbers while I was away: the team has grown to 35 people, and there are now separate business units for all the tasks I had the opportunity to join on a rotational basis as a junior. These are the CE team, who build business applications for clients, the data team, who deliver data analytics and visualisation solutions, and there's the ERP team - of which I became part - where we introduce Microsoft's enterprise management solutions (Dynamics 365 Finance and Operations and Business Central) to clients.What I would perhaps highlight from this is that even though these specialisations have evolved, it has not brought with it a siloed operation. To deliver work in our own area, we have access to the knowledge of other areas, and we mutually help each other across teams to deliver the highest quality service possible. From this perspective, what has changed in 3 years? I would say nothing; what worked then on a small scale, works now on a bigger scale.

Agile operation

We have had a solid vision of how we deliver solutions since I was a junior employee here: the agile methodology. What was in its infancy is now mature. If not fully agile, it uses the agile elements so well that it supports our work to a great extent on a day-to-day basis.It helps us communicate internally and to our customers by allowing them to post issues in DevOps that we help them resolve; we write features, user stories, test cases that help us with needs assessment and implementation. We have daily stand-up meetings with the team in the mornings where we discuss our stumbling blocks, at the end of the week we have sprint rounds where we always plan the next week's sprint, and monthly we have a retros where we pay special attention to feedback to each other, looking back on the past 1 month.

Team and all the fun

Unfortunately, during my first job, I didn't get much of that live because of Covid, but even then I had those short conversations at the beginning of a call or at the morning "all-people" DSMs that reinforced the sense of belonging to the team and the good atmosphere. Fortunately, we have kept this habit ever since, so no call is ever dull. And once the epidemic subsided, these community events only grew stronger, with regular team-building events, VL team-building retreats, co-hosted Christmas and Halloween parties.It's also a good day at the office. Although it varies from day to day, we have little rituals that colour the days and take the focus off work. For example, the daily lunch together in the office, chit-chat while making coffee, or just passing a funny comment to each other at the next desk, or the monthly office day when we all go in and look back over the past month. In short, you never get bored here. 😊

Coming back to a place where I've worked before is a special experience - especially when so much has changed in the meantime. VisualLabs has retained the supportive community and vibrancy that I grew to love, while reaching new levels of development and professionalism. This journey has been a learning experience not only for the company, but also for me, as the old and new experiences have given me a stronger, more mature perspective. I look forward to being a part of the next chapter and seeing where the company goes in the future!

Recap: Budapest BI Forum
10 mins read
Apr 10, 2025

Recap: Budapest BI Forum

The first day was a full-day Tabular Editor workshop, where we covered the basics and discussed topics such as controlling perspectives, writing macros, and refreshing partitions. The other two days of the conference were packed with learning, and here are my key takeaways from my favorite sessions.

Read more

Hey everyone! Here’s a summary of the Budapest BI Forum 2024, where I had the chance to dive into some intriguing topics and engage in inspiring conversations.

The first day was a full-day Tabular Editor workshop, where we covered the basics and discussed topics such as controlling perspectives, writing macros, and refreshing partitions. The other two days of the conference were packed with learning, and here are my key takeaways from my favorite sessions.

Keynote Speech: BI Trends

The day kicked off with a keynote that explored current and future BI trends.

Bence, the main organizer and host of the event, supported his key points with insights from Gartner research and similar studies. A few highlights that caught my attention:

  • By 2025, data security and data governance are expected to top the list of priorities for executives.
  • The rapid rise of AI introduces scenarios where users export data from dashboards to Excel, feed it into tools like ChatGPT, and generate their own insights. While exciting, this raises concerns about security and "shadow reporting," issues companies have tried to curb for years.

As a contractor and consultant I find this especially ironic. Large companies often hesitate to share data, even when it’s crucial for project development. They implement robust policies like VPNs and restricted searches to prevent leaks. But, at the same time, they struggle to monitor and control employees' behaviors, such as inadvertently sharing sensitive data.

This evolving dynamic between AI, data security, and governance will definitely be a space to watch closely.

Read more about Gartner’s 2024 BI trends here.

PBIR: Report Development in Code

This technical session introduced the PBIR format, a preview feature that allows Power BI reports to be stored as individual JSON files for each visual and page, instead of a monolithic file.

The feature’s potential for bulk modifications was the most exciting part. The presenter showed how Python scripts could iterate through the JSON files to apply changes (e.g., adding shadows to all KPI cards) across the report.

While still in preview and somewhat buggy, it’s a promising direction. I’m also intrigued by the integration possibilities with VS Code and GitHub Copilot, which could simplify automation for non-coders.

However, it seems TMDL language won’t be integrated into PBIR anytime soon—a bit disappointing, but I’m optimistic this will eventually happen.

TMDL Enhancements in Power BI & VS Code

One of the most exciting parts of the forum was exploring updates to TMDL (Tabular Model Definition Language), designed to make Power BI model development more efficient.

TMDL View in Power BI

This might be the feature I’m most excited about! The ability to edit your semantic model as code directly inside Power BI is a massive leap forward. Combining drag-and-drop, Copilot, and coding will make development smarter and faster.

Immediate Code Updates in Power BI (Planned for Next Year)

A handy feature to look forward to is real-time synchronization between modified TMDL code and Power BI. Changes to the model will reflect instantly in Power BI without reopening the file, saving tons of time during development.

VS Code TMDL Extension

The TMDL extension in VS Code offers:

  • Formatting: Automatically organizes TMDL syntax.
  • IntelliSense and Autocomplete: Speeds up coding with intelligent suggestions.
  • Expand/Collapse Functionality: Makes navigating larger TMDL files easier.

Get the extension here.


Copilot Integration in VS Code

Copilot lets you generate measures, calculations, and scripts with AI assistance. For example, as you type "Profit," Copilot suggests a complete formula based on the context. It’s a productivity boost I can’t wait to leverage more!

Online Editing with VSCode.dev

You can now edit repositories directly in your browser using the vscode.dev prefix for your repository URL. It’s perfect for quick edits without setting up a local environment.

These updates are poised to make model development faster, smarter, and more collaborative for teams using GitHub and VS Code.

Lunch Break with Insights from Microsoft

Lunch turned into one of the highlights of the day when Tamás Polner, a key figure at Microsoft, joined our table. Tamás shared some fascinating insights about the current direction of Microsoft’s data ecosystem and upcoming trends:

  • Fabric focus: Microsoft is heavily prioritizing Fabric over tools like ADF and Synapse, which are expected to receive basically no new feature updates as development resources shift toward Fabric. While this has been an industry assumption for a while, it was great to have this firsthand confirmation. The message is clear: Fabric is the future of Microsoft’s data ecosystem.
  • Data security: Reflecting on the keynote’s emphasis on data security, Tamás explained that this aligns with what he’s seeing at Microsoft. The number of developers in the security team is increasing significantly, and this trend doesn’t seem to be slowing down.
  • Optimized compute consumption: We also discussed CU (Compute Unit) optimization in Fabric. Tamás reaffirmed something I’d heard in Fabric training sessions: notebooks are far more powerful and efficient than UI-powered features like Dataflow Gen2. They use significantly less compute capacity, making them the better choice for many workflows.
  • DP-600 exam: Tamás mentioned that the DP-600 exam has become one of the most successful certifications in Microsoft’s history, with a record high number of certifications achieved in short time.
  • Copilot and AI: Copilot is a major focus for Microsoft, but its rollout faces challenges due to the high resource intensity of AI models. Tamás noted that, like other companies deploying built-in AI solutions, Microsoft needs to continue investing heavily in CAPEX for computing power to make these solutions broadly accessible.


This conversation provided valuable context and insight into Microsoft’s strategic priorities and was a great opportunity to discuss industry trends and technical strategies in detail.


Storytelling with Power BI

This session revisited a topic close to my heart: how to create Power BI reports that truly connect with their audiences. The presenter broke it down into three key phases:

  1. Research: Start by understanding the report’s purpose. Who will use the report? What decisions should it support? Can the goal be summarized in one clear, concise sentence?
  2. Create: Develop the report based on your research. Ensure that the visuals, design, and structure align with the user’s needs and the intended outcomes.
  3. Deliver: It’s not just about handing over the report and documentation, then walking away. True success lies in monitoring how the report is used and gathering user feedback. This feedback often reveals both strengths and weaknesses you didn’t anticipate, providing opportunities to refine and enhance the report further.

While much of this was a confirmation of what I already practice, it underscored an essential point: The discovery phase and follow-ups are just as critical as the actual development process.

It’s also a reinforced me that educating clients about the value of these stages is crucial. When clients understand that investing time and resources into proper research and post-delivery follow-ups leads to better reports and happier users, they’re much more likely to embrace these processes.


Final Thoughts

The day was packed with insights, but what truly stood out was the seamless blend of technical innovation and strategic foresight. Whether it was exploring new options like TMDL and PBIR, or gaining a deeper understanding of the big-picture trends shaping the future of BI, the forum offered something valuable for everyone.

Of course, the lunch chat with Tamás was a treasure trove of insider knowledge—easily one of the event’s highlights for me. Another personal highlight was a heartfelt conversation with Valerie and Elena, who encouraged me to take the next step in my professional journey: becoming a conference speaker.

If any of these topics piqued your interest or you’d like me to dive deeper into specific sessions, just let me know—I’d be happy to share more!

Create efficient and customized Release Notes with Bravo Notes
10 mins read
Apr 10, 2025

Create efficient and customized Release Notes with Bravo Notes

For our customers, it is important that when we deliver a new version of their existing IT system, we also provide a release note on the content and functionality of the released package. At Visuallabs, we constantly strive to meet our customers’ needs to the maximum, all while simplifying our own workflows and increasing our administrative efficiency.We are supported in this by the Bravo Notes available in DevOps. Using this plug-in, we produce a unique yet standardized Release Note with each new development package delivery. This allows us to meet our customers’ requirements in a fast and standardized way.

Read more

For our customers, it is important that when we deliver a new version of their existing IT system, we also provide a release note on the content and functionality of the released package. At Visuallabs, we constantly strive to meet our customers' needs to the maximum, all while simplifying our own workflows and increasing our administrative efficiency. We are supported in this by the Bravo Notes available in DevOps. Using this plug-in, we produce a unique yet standardized Release Note with each new development package delivery. This allows us to meet our customers' requirements in a fast and standardized way.

What is needed to do this?

By following a few simple principles in our delivery processes, the documentation we already produce provides a good basis for generating standard version documents in a few steps for our releases or bug fixes.

How do we document?

  • The conventions for using the various purpose fields available on a given DevOps element will be strictly adhered to and filled in in a way that is appropriate for the document being generated.
  • User Stroy descriptions are prepared in a standard format. This allows us to provide standard quality for our customers and to build in automated document generation.
  • Tickets are sorted by transport unit. This helps when responding to multiple business challenges from the customer at the same time. Documentation of delivered enhancements and system changes can then be categorised in one document.

Using Bravo Notes

Bravo Notes provides technical assistance to help you meet these requirements with the right customisation.The main functions we use:

  • Compiling content: there are several options to choose from when selecting items from DevOps. We use Query most often among the options shown in the screenshot below, because the multiple filtering criteria allow us to select relevant elements more efficiently, thus making the documentation more precise.
  • Template: In Bravo Notes, we have created various templates to organise the news into a proper structure.  

Main units of the template developed:

  • In the case where several delivery units or business processes are involved for a system release, the relevant descriptions are grouped together in the document.
  • A further organizing principle in the template is that new developments are shown in a feature-by-feature breakdown, and solutions to bugs are also shown in a separate unit. This makes it clear which supported feature a given release item refers to, whether it is a new development or a bug fix.
  • Use parameters: parameters based on business processes allow you to customise the generation of documents. During generation, you can change the title, date, release date and add comments to the document. You can also specify the applications and resources involved, for example, which business area or environment is affected.
  • Display of document units and headings based on a set of rules: it is handled in the template to display only the relevant headings and document parts; e.g. if there was no error correction in a given delivery unit, its heading is not displayed either.
  • Fields used in the template: as defined above, we provide easy-to-read descriptions for the released developments. The consistent documentation of the DevOps tickets used in the design or development process allows this to be done quickly and in a standardized way. The content of the fields defined in the template about the tickets is automatically included when the document is generated.
  • Export: After generation and verification, we export your document to PDF format.

Testimonials: Overall, it is therefore important for our customers to receive detailed and business-relevant documentation on the new versions provided for the systems they use.We are also trying to simplify our own workflows.The Bravo Notes module integrated into DevOps supports us in achieving these goals.With this plug-in, we create customized yet standardized Release Notes with each new development package delivery. This allows us to meet our customers' requirements in a fast and standardised way, providing them with the necessary information and transparency on system changes and enhancements.

Soft blue and white gradient background with blurred smooth texture
Filter
Industry
Technology
Solution category
Thank you! Your submission has been received!
Oops! Something went wrong while submitting the form.
How to Use the URL Site Map Subarea Type for View Display
April 10, 2025
3 min read
How to Use the URL Site Map Subarea Type for View Display
Read more

Problem Statement

We love custom views in Dynamics 365, but often face the challenge of integrating these views easily and effectively into the Site Map. Many times, we encounter the issue of only being able to specify a default view for a given table. With this solution, we can display custom views as separate menu items while maintaining user experience and clarity.

Possible Use Case

For example, if we want to track our projects by displaying ongoing and closed projects in separate menus, we can insert the URL of the views into the Site Map. Let’s go through this scenario:

           
  • Create a custom view in the Project table that filters ongoing projects. The URL for this view is::https://**********.crm4.dynamics.com/main.aspx?appid=**************&pagetype=entitylist&etn=msdyn_project&view=5ba30ec3-a0f1-ee11-904b-000d3a64fb2d&viewType=1039
my in progress projects
           
  • Create a custom view in the Project table that filters closed projects. The URL for this view is::
             
    • https://**********.crm4.dynamics.com/main.aspx?appid=**************&pagetype=entitylist&etn=msdyn_project&view=2ce26bab-a1f1-ee11-904b-000d3a64fb2d&viewType=1039

Default Behavior

In the Site Map, if we select the URL type and insert the view’s URL, opening it from the app will open the view in a new tab, pointing to the default table of the view, and not staying in the specified Site Map menu item.

Goal

When clicking the newly created menu item in the Site Map, it should not open the view in a new window, nor jump to the Projects menu item. Instead, it should remain in the clicked menu and display the view in the currently open window.
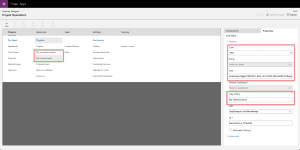
Solution

In the Site Map, when adding the new URL type element, do not insert the entire URL copied when opening the view. Instead, insert only the part after "dynamics.com":

/main.aspx?appid=**************&pagetype=entitylist&etn=msdyn_project&view=2ce26bab-a1f1-ee11-904b-000d3a64fb2d&viewType=1039

User Interface After Publishing the Site Map

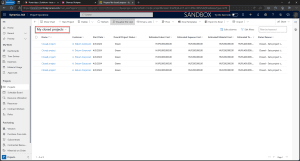
For ongoing projects:

We see that the menu item did not switch to a new tab, and the selection remained on the chosen menu. Note that this menu item also points to the msdyn_project table, but displays the view relevant to us.

For closed projects

We see that the menu item did not switch to a new tab, and the selection remained on the chosen menu. Note that this menu item also points to the msdyn_project table, but displays the view relevant to us.

Additional Thoughts

It’s important to understand that this solution can be applied not only to custom views but also to other Dynamics 365 objects. Imagine how much we can integrate into the application!

Practical Tips

           
  • Remember to test the solution in different browsers and devices to ensure the application’s overall compatibility.
  •        
  • Use custom icons or labels for the menu items to make the Site Map even easier to navigate.

These innovations can revolutionize our work in Dynamics 365, allowing us to work more efficiently and take full advantage of the application’s capabilities! If you have any questions, feel free to contact us!

Optimization from Head to Toe: Structuring Backlogs at Visual Labs, Part Three
April 10, 2025
4 min read
Optimization from Head to Toe: Structuring Backlogs at Visual Labs, Part Three
Read more

The Hierarchy of Administrative Work: New Dimensions in Backlog Structure

admin

In project management, administrative tasks often blend with core project activities, causing confusion and reducing efficiency. When structuring backlogs, it's essential to consider the hierarchy of administrative tasks, which helps the team better organize and manage their work. The L1, L2, and L3 levels reflect the relationship of these administrative tasks. Let's see how we can apply this hierarchy to administrative work!

L1 – Basic Administrative Tasks

The L1 level includes fundamental administrative tasks that hold strategic importance for the entire organization. These tasks are crucial for the smooth operation of the project and may encompass a wide range of activities.

L2 – Intermediate Administrative Activities

The second level, L2, includes more complex administrative activities that are more specific than L1 tasks but still exceed daily routines. This category includes internal training, pre-sales activities, HR tasks, and activities that promote teamwork and communication. L2 activities are key to the company's long-term stability but generally require more time and planning than L1 tasks.

L3 – Complex Administrative Projects

The L3 level represents the most basic administrative tasks, such as daily report preparation or handling ad-hoc tasks. These tasks are more specific within each category.Structuring administrative tasks hierarchically in the backlog helps teams better understand and manage different types of work, allowing for more efficient resource utilization and time management.

Beyond the Green Checkmark: Azure DevOps Statuses at Visual Labs

At Visual Labs, we prioritize delivering client needs efficiently and on time. We use the Azure DevOps system, which helps us manage client needs in a structured way and ensures that we track every step of the process. With Features and User Stories, we accurately record where each need is in the delivery process, ensuring transparency and efficiency for the entire team and the client.

under delivery

Feature: Features handle new client needs at the client request level. They go through the following stages:

New   New client request. Not yet being worked on.
Design   We have started proposing a solution. An estimate is released during the design phase.
Awaiting Approval   Waiting for client response to approve the solution and the provided estimate/offer.
Awaiting Delivery   The client has accepted, and we have scheduled the delivery.
Under Delivery   We have started working on the request based on the submitted proposal.
Under Deployment   The feature has been delivered, and we are waiting for client validation.
Closed   The client has accepted, delivered, invoiced, or ready to be invoiced.
Removed  

During the process, it was determined that the feature is not needed. It can be set to Removed status.

user story

User Story: User Stories relate to Features and break them down into more detailed tasks. User Stories follow the same phases as Features but have slightly different interpretations and applications:

  • New: A new client request that has been realized and broken down into smaller units (i.e., User Stories). We know at a high level what needs to be done, but no one has started working on it yet.
  • Design: When we start working on the User Story description and acceptance criteria, and plan the technical requirements and delivery.
  • Awaiting Approval: The defined User Story is handed over to the client for approval to ensure it meets their expectations.
  • Awaiting Delivery: After client approval, but before actual development and work begin. All conditions are met to start working on it, but work has not started yet.
  • Under Delivery: The moment the development of the request begins.
  • Under Deployment: The completed development is waiting for release in the client environment. The User Story gets Under Deployment status when the requested functionality has been delivered on our side, handed over to the client, and we are waiting for client validation.
  • Closed: Once client-side validation is complete, the User Story can be closed. Ideally, this happens when the client closes the User Story, but we can also do it internally once we have received written validation.
  • Removed: If it turns out that the development is not needed after creating the User Story, or it cannot be implemented as previously planned. The User Story gets Removed status and a new User Story is created to continue the development request.

Using the Azure DevOps system and having clear processes and statuses ensures we manage every client need efficiently and deliver on time. This enhances client satisfaction and improves the transparency and efficiency of the delivery process at Visual Labs.

Account!T – A Small Step for Developers, a Giant Leap for Accountants
April 10, 2025
3 min read
Account!T – A Small Step for Developers, a Giant Leap for Accountants
Read more

“One small step for man, one giant leap for mankind” – Neil Armstrong’s iconic words from 1969 still resonate today. While comparing a moon landing to a modest extension of Business Central may seem far-fetched, this phrase came to mind as I reflected on our ERP team’s latest enhancement.

Our clients often refer to us as programmers or developers, a term we’ve grown accustomed to and usually accept with a resigned smile. But the reality is, you don’t always need large-scale developments to deliver a better, more usable product. Adding a simple field to the right screen can significantly streamline business users’ tasks, whether it’s for general ledger reconciliation, providing easier data for auditors, or shortening a user workflow by three clicks. That’s what we mean by a giant leap.

The Visual Labs ERP team has successfully implemented many Business Central projects locally. Through these projects, we’ve learned and adapted with our clients, extending the out-of-the-box Business Central product and its complementary Hungarian localization with various minor enhancements and customizations. We’ve bundled these small modifications into our own extension, making the system’s financial modules more user-friendly. We aptly named it Account!T.

In this blog post, we’ll highlight three features of our custom extension:

Notification for Failed Online Invoice Data Submission

As part of the Hungarian localization of Business Central, there's an online invoice interface that automatically submits data to the tax authority (NAV). This process is successful 99% of the time. However, there are instances where NAV rejects an invoice due to errors (like a typo in the postal code or an incorrect VAT rate). These errors are logged on the Online Invoice List page but do not generate a system notification, although legally required to submit the data.

To simplify this process and aid users, we developed an enhancement that detects online invoice submission errors. On the user's role center page, which opens at each login, we added a tile counting the erroneous online invoices. This tile turns red when there are errors needing correction, and turns green after successful data submission.

online invoice

We also enabled an option to specify an email address to which the system sends a message containing a clickable link to the erroneous invoice record. This ensures the responsible user is promptly informed and can submit the corrected invoice data to the tax authority in time.

Adding the Source Name Field to the General Ledger Entries Page

Accountants regularly reconcile the general ledger and subsidiary ledgers. To improve this efficiency, we made the Source Name field available on the Business Central General Ledger Entries page. The out-of-the-box system stopped at displaying the Source Account field.

This field contains the master data identifier of the posted entry from another module (e.g., customer, vendor, bank). Previously, identifying the partner name from the subsidiary ledger required extra Excel VLOOKUP formulas. By making the Source Name field available, the associated name now appears directly by linking the underlying master data tables.

Főkönyvi tételek - forrás neve

Disabling the Boxed Posting Date Validation Logic for Bank Postings

One routine task for the finance department is reconciling bank postings. Business Central includes an unavoidable posting date validation. If the bank transaction date precedes the posting date, the system blocks the posting unless the bank transaction date is modified. This discrepancy can cause reconciliation issues. For instance, an invoice covering multiple periods (like an insurance fee) might be posted with a year-end date.To resolve this, we made the boxed validation logic optional for the following documents:

  • Payment Reconciliation Journal
  • General Journal
  • Cash Desk
fizetés kiegyenlítése

These scenarios and similar ones are common for almost every Business Central user. That's why we bundled them into our custom extension, reducing unnecessary clicks and extra work, streamlining daily operations.For more details or questions, feel free to contact us. We're here to help. 😊

Optimization from Top to Bottom: How We Structure Backlogs at Visual Labs, Part 2
April 10, 2025
2 min read
Optimization from Top to Bottom: How We Structure Backlogs at Visual Labs, Part 2
Read more

From Customer Needs to Implementation: The Journey of an Efficient Delivery Backlog

delivery backlog

In this hierarchical model, we start with epics, representing the overall project, and break down the development cycle through various levels right up to testing. This approach helps organize work, set priorities, and track progress. Let’s dive into each element and its significance:

Epic: At the highest level, the epic represents the project itself. This category encompasses the overarching goals and the project framework. Features and user stories under the epic serve to achieve specific objectives.

Feature: Within an epic, features reflect customer needs. These are concrete requirements and expectations expressed by customers that we aim to meet throughout the project.

PBI (Product Backlog Item): These are elements of the product backlog, which can be issues or user stories.

Action: Specific activities that need to be completed to achieve the project’s goals.

Issue: Problems or bugs identified during the project, as noticed by customers.

User Story (US): Detailed breakdowns of customer requirements. These are short, simple descriptions that outline the functionalities and benefits customers expect from the product. User stories help developers understand and accurately fulfill customer needs.

  • Task: Specific tasks derived from user stories and features that the project team must complete.Bug: Software defects identified during development. These can be issues found by either customers or developers.
  • Build: Development tasks aimed at creating a new version of the software.
  • Test Case: Test scenarios that specify what tests need to be executed to verify different aspects of the software.
  • Test Plan: A comprehensive plan that includes all available test cases and their results.
  • The process model illustrated here covers every step of the software development cycle, from requirement gathering to testing. This aids project teams in effectively managing development activities, improving software quality, and ensuring project success. This model not only organizes needs and work but also facilitates communication with customers.
  • By following this structure, Visual Labs ensures that all aspects of the project are covered comprehensively, promoting efficiency and clarity throughout the development process.
Optimization from Top to Bottom: How We Structure Backlogs at Visual Labs, Part 1
April 10, 2025
2 min read
Optimization from Top to Bottom: How We Structure Backlogs at Visual Labs, Part 1
Read more

At Visual Labs, we leverage Azure DevOps, a powerhouse tool in software development and project management. It empowers teams to efficiently manage their work from development to release. One critical element that can significantly influence project success is the structure of the backlog. A well-organized backlog not only ensures task and requirement transparency but also helps teams set priorities, respond effectively to changes, and closely monitor project progress.

In our upcoming blog series, we will showcase the backlog structures we use, highlight the differences between them, and discuss the typical work items in these backlogs.

In this blog post, we’ll delve into how we create and efficiently manage an Azure DevOps backlog. We’ll explore practices and tips to help teams maximize their backlog’s potential. We’ll cover how to handle requirements and tasks, and how to ensure the backlog reflects the current goals and challenges of the project. Join us to discover how we enhance project management efficiency with Azure DevOps!

At Visual Labs, we distinguish between two different backlog levels:

1. Delivery Backlog:

This type of backlog contains tasks related to project or product development. It includes software development, implementing new features, bug fixes, user stories related to customer needs, and any other activities that directly impact the product or project’s output. The goal is to support the continuous development and delivery of the product or service. Tasks in this backlog typically have higher priority as they directly contribute to customer value.

2. Admin Backlog:

The admin backlog encompasses tasks related to the project’s or team’s administrative, organizational, or internal operations. This includes updating internal documentation, ensuring regulatory compliance, training team members, or any activities that are not directly linked to product or service delivery but are essential for smooth operation. While these tasks might be less urgent or critical from a product perspective, they are vital for maintaining team efficiency and seamless project execution.

Summary:

The delivery backlog focuses on product development and delivery, while the admin backlog handles internal operations and administrative activities. Both are crucial for successful project management and teamwork but concentrate on different aspects.

DOJO
April 10, 2025
3 min read
DOJO
Read more

Background

The forum for operational development at Visual Labs is called Dojo. These sessions are held every Tuesday morning for one and a half hours. Originally launched in January 2023, Dojo was a half-day event held every two weeks and could only be attended in person.Participation in Dojo sessions is optional, although certain colleagues are often expected to attend due to their expertise. The topics of Dojo are determined by quarterly goals, and the exact agenda is set by management. These topics cover a wide range of areas, aiming to contribute to organizational development.

Why is it necessary?

Despite being a small organization, we work in distinctly defined technological areas (ERP, CRM, BI) that often serve the same clients. It is essential to have a common forum where we can gain insights into each other’s work or the company’s operations (e.g., ERP or BI colleagues are welcome at a CRM hackathon). This allows for collective thinking about how Visual Labs can develop as an organization.

Topics Covered So Far

Among others, the following topics have been discussed in Dojo sessions:

  • Using Azure DevOps (see: Optimization from Top to Bottom: How We Structure Backlogs at Visual Labs, Part One)
    • Feature delivery process
    • Managing work items
    • Defining work items
    • Handling statuses
  • Refining financial planning and billing processes
  • Hackathon for improving our internal CRM
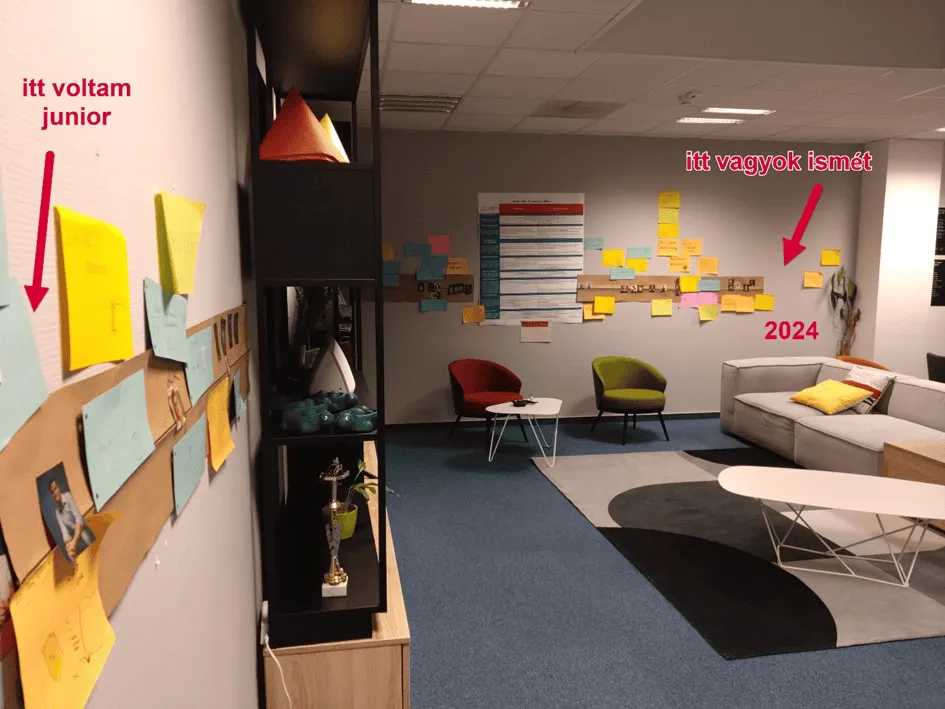
  • Brainstorming on the development of our increasingly cramped office
  • Solution-seeking:
    • For technical challenges
    • For broadly defined, exciting client needs
  • Power Platform Starter Kit
    • Launching the PowerPlatform Center of Excellence (CoE) Starter Kit
    • Agile sprint review and planning ceremonies for the Visual Labs enhancement of the PowerPlatform Starter Kit ([[CoE+]]), where we also tested our agile wings 🙂
  • Customer relationship and competency training for POs, conducted by our regular coach, Klára Sugta
  • Knowledge sharing on the following topics:
    • Customer visits
    • Project launches

What Has Dojo Given Us?

Key achievements:

  • Creation of a Dojo Handbook that defines our main processes and operations, which we keep up to date.
  • Further development of the Microsoft-developed Power Platform Center of Excellence Toolkit [[CoE+]], cataloging Azure resources, DevOps projects, and areas that can be assigned to teams and users.
  • Strengthening and integrating the competencies outlined in the Competency Matrix into our daily routines.
  • Introduction of monthly financial planning with weekly tracking.
  • Development of our own CRM system (based on Dynamics 365 Sales and Project Operations, in collaboration with CoE+).

Other Forums for Organizational Development

  • Team Retrospectives
    • While Dojo generally deals with cross-departmental or company-wide topics identified by management, retrospectives at the team level focus on system-level improvements in individual collaboration.
    • In the future, it will be important to create a development backlog (Kaizen) to provide an overarching view of areas needing improvement, to which initiatives can be assigned and receive the necessary buy-in and resources.
  • 1on1s
    • The most straightforward opportunity to foster bottom-up ideas is through 1on1s, where topics can ripple up to management level.

The Future of Dojo

Dojo will continue to be the main forum for organizational development and will remain optional. We aim to facilitate participation in organizational development asynchronously and ensure that more written records of Dojo discussions are kept. Often, colleagues cannot attend sessions on topics they find interesting or do not find it worthwhile to sit through the entire discussion but would find a "tl;dr" version useful.If you want more information about our Dojo sessions or the topics discussed, follow our blog, as new articles on these topics are continuously published. If you have any questions or comments, don't hesitate to contact us!

Sorry, no items found with this category

Ready to talk about your use cases?

Request your free audit by filling out this form. Our team will get back to you to discuss how we can support you.

Thank you! Your submission has been received!
Oops! Something went wrong while submitting the form.
Stay ahead with the latest insights
Subscribe to our newsletter for expert insights, industry updates, and exclusive content delivered straight to your inbox.
Thank you! Your submission has been received!
Oops! Something went wrong while submitting the form.