Recap: Budapest BI Forum

Daniel Patkos

Hey everyone! Here’s a summary of the Budapest BI Forum 2024, where I had the chance to dive into some intriguing topics and engage in inspiring conversations.
The first day was a full-day Tabular Editor workshop, where we covered the basics and discussed topics such as controlling perspectives, writing macros, and refreshing partitions. The other two days of the conference were packed with learning, and here are my key takeaways from my favorite sessions.
Keynote Speech: BI Trends
The day kicked off with a keynote that explored current and future BI trends.
Bence, the main organizer and host of the event, supported his key points with insights from Gartner research and similar studies. A few highlights that caught my attention:
- By 2025, data security and data governance are expected to top the list of priorities for executives.
- The rapid rise of AI introduces scenarios where users export data from dashboards to Excel, feed it into tools like ChatGPT, and generate their own insights. While exciting, this raises concerns about security and "shadow reporting," issues companies have tried to curb for years.
As a contractor and consultant I find this especially ironic. Large companies often hesitate to share data, even when it’s crucial for project development. They implement robust policies like VPNs and restricted searches to prevent leaks. But, at the same time, they struggle to monitor and control employees' behaviors, such as inadvertently sharing sensitive data.
This evolving dynamic between AI, data security, and governance will definitely be a space to watch closely.
Read more about Gartner’s 2024 BI trends here.
PBIR: Report Development in Code
This technical session introduced the PBIR format, a preview feature that allows Power BI reports to be stored as individual JSON files for each visual and page, instead of a monolithic file.
The feature’s potential for bulk modifications was the most exciting part. The presenter showed how Python scripts could iterate through the JSON files to apply changes (e.g., adding shadows to all KPI cards) across the report.
While still in preview and somewhat buggy, it’s a promising direction. I’m also intrigued by the integration possibilities with VS Code and GitHub Copilot, which could simplify automation for non-coders.
However, it seems TMDL language won’t be integrated into PBIR anytime soon—a bit disappointing, but I’m optimistic this will eventually happen.
TMDL Enhancements in Power BI & VS Code
One of the most exciting parts of the forum was exploring updates to TMDL (Tabular Model Definition Language), designed to make Power BI model development more efficient.
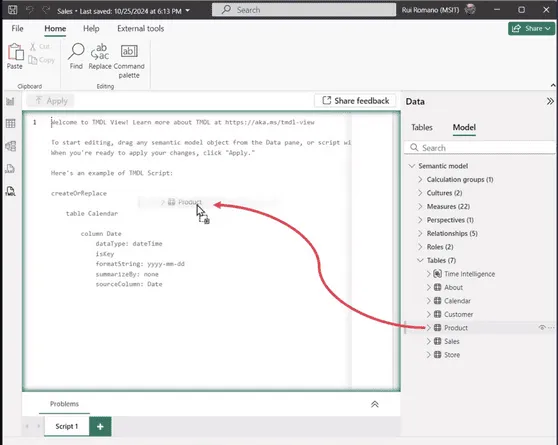
TMDL View in Power BI
This might be the feature I’m most excited about! The ability to edit your semantic model as code directly inside Power BI is a massive leap forward. Combining drag-and-drop, Copilot, and coding will make development smarter and faster.
Immediate Code Updates in Power BI (Planned for Next Year)
A handy feature to look forward to is real-time synchronization between modified TMDL code and Power BI. Changes to the model will reflect instantly in Power BI without reopening the file, saving tons of time during development.
VS Code TMDL Extension
The TMDL extension in VS Code offers:
- Formatting: Automatically organizes TMDL syntax.
- IntelliSense and Autocomplete: Speeds up coding with intelligent suggestions.
- Expand/Collapse Functionality: Makes navigating larger TMDL files easier.
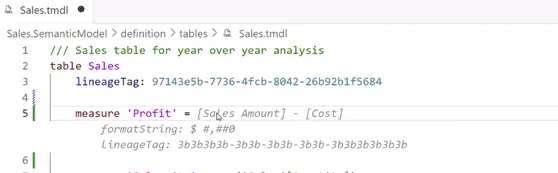
Copilot Integration in VS Code
Copilot lets you generate measures, calculations, and scripts with AI assistance. For example, as you type "Profit," Copilot suggests a complete formula based on the context. It’s a productivity boost I can’t wait to leverage more!
Online Editing with VSCode.dev
You can now edit repositories directly in your browser using the vscode.dev prefix for your repository URL. It’s perfect for quick edits without setting up a local environment.
These updates are poised to make model development faster, smarter, and more collaborative for teams using GitHub and VS Code.
Lunch Break with Insights from Microsoft
Lunch turned into one of the highlights of the day when Tamás Polner, a key figure at Microsoft, joined our table. Tamás shared some fascinating insights about the current direction of Microsoft’s data ecosystem and upcoming trends:
- Fabric focus: Microsoft is heavily prioritizing Fabric over tools like ADF and Synapse, which are expected to receive basically no new feature updates as development resources shift toward Fabric. While this has been an industry assumption for a while, it was great to have this firsthand confirmation. The message is clear: Fabric is the future of Microsoft’s data ecosystem.
- Data security: Reflecting on the keynote’s emphasis on data security, Tamás explained that this aligns with what he’s seeing at Microsoft. The number of developers in the security team is increasing significantly, and this trend doesn’t seem to be slowing down.
- Optimized compute consumption: We also discussed CU (Compute Unit) optimization in Fabric. Tamás reaffirmed something I’d heard in Fabric training sessions: notebooks are far more powerful and efficient than UI-powered features like Dataflow Gen2. They use significantly less compute capacity, making them the better choice for many workflows.
- DP-600 exam: Tamás mentioned that the DP-600 exam has become one of the most successful certifications in Microsoft’s history, with a record high number of certifications achieved in short time.
- Copilot and AI: Copilot is a major focus for Microsoft, but its rollout faces challenges due to the high resource intensity of AI models. Tamás noted that, like other companies deploying built-in AI solutions, Microsoft needs to continue investing heavily in CAPEX for computing power to make these solutions broadly accessible.
This conversation provided valuable context and insight into Microsoft’s strategic priorities and was a great opportunity to discuss industry trends and technical strategies in detail.
Storytelling with Power BI
This session revisited a topic close to my heart: how to create Power BI reports that truly connect with their audiences. The presenter broke it down into three key phases:
- Research: Start by understanding the report’s purpose. Who will use the report? What decisions should it support? Can the goal be summarized in one clear, concise sentence?
- Create: Develop the report based on your research. Ensure that the visuals, design, and structure align with the user’s needs and the intended outcomes.
- Deliver: It’s not just about handing over the report and documentation, then walking away. True success lies in monitoring how the report is used and gathering user feedback. This feedback often reveals both strengths and weaknesses you didn’t anticipate, providing opportunities to refine and enhance the report further.
While much of this was a confirmation of what I already practice, it underscored an essential point: The discovery phase and follow-ups are just as critical as the actual development process.
It’s also a reinforced me that educating clients about the value of these stages is crucial. When clients understand that investing time and resources into proper research and post-delivery follow-ups leads to better reports and happier users, they’re much more likely to embrace these processes.
Final Thoughts
The day was packed with insights, but what truly stood out was the seamless blend of technical innovation and strategic foresight. Whether it was exploring new options like TMDL and PBIR, or gaining a deeper understanding of the big-picture trends shaping the future of BI, the forum offered something valuable for everyone.
Of course, the lunch chat with Tamás was a treasure trove of insider knowledge—easily one of the event’s highlights for me. Another personal highlight was a heartfelt conversation with Valerie and Elena, who encouraged me to take the next step in my professional journey: becoming a conference speaker.
If any of these topics piqued your interest or you’d like me to dive deeper into specific sessions, just let me know—I’d be happy to share more!
Blog posts
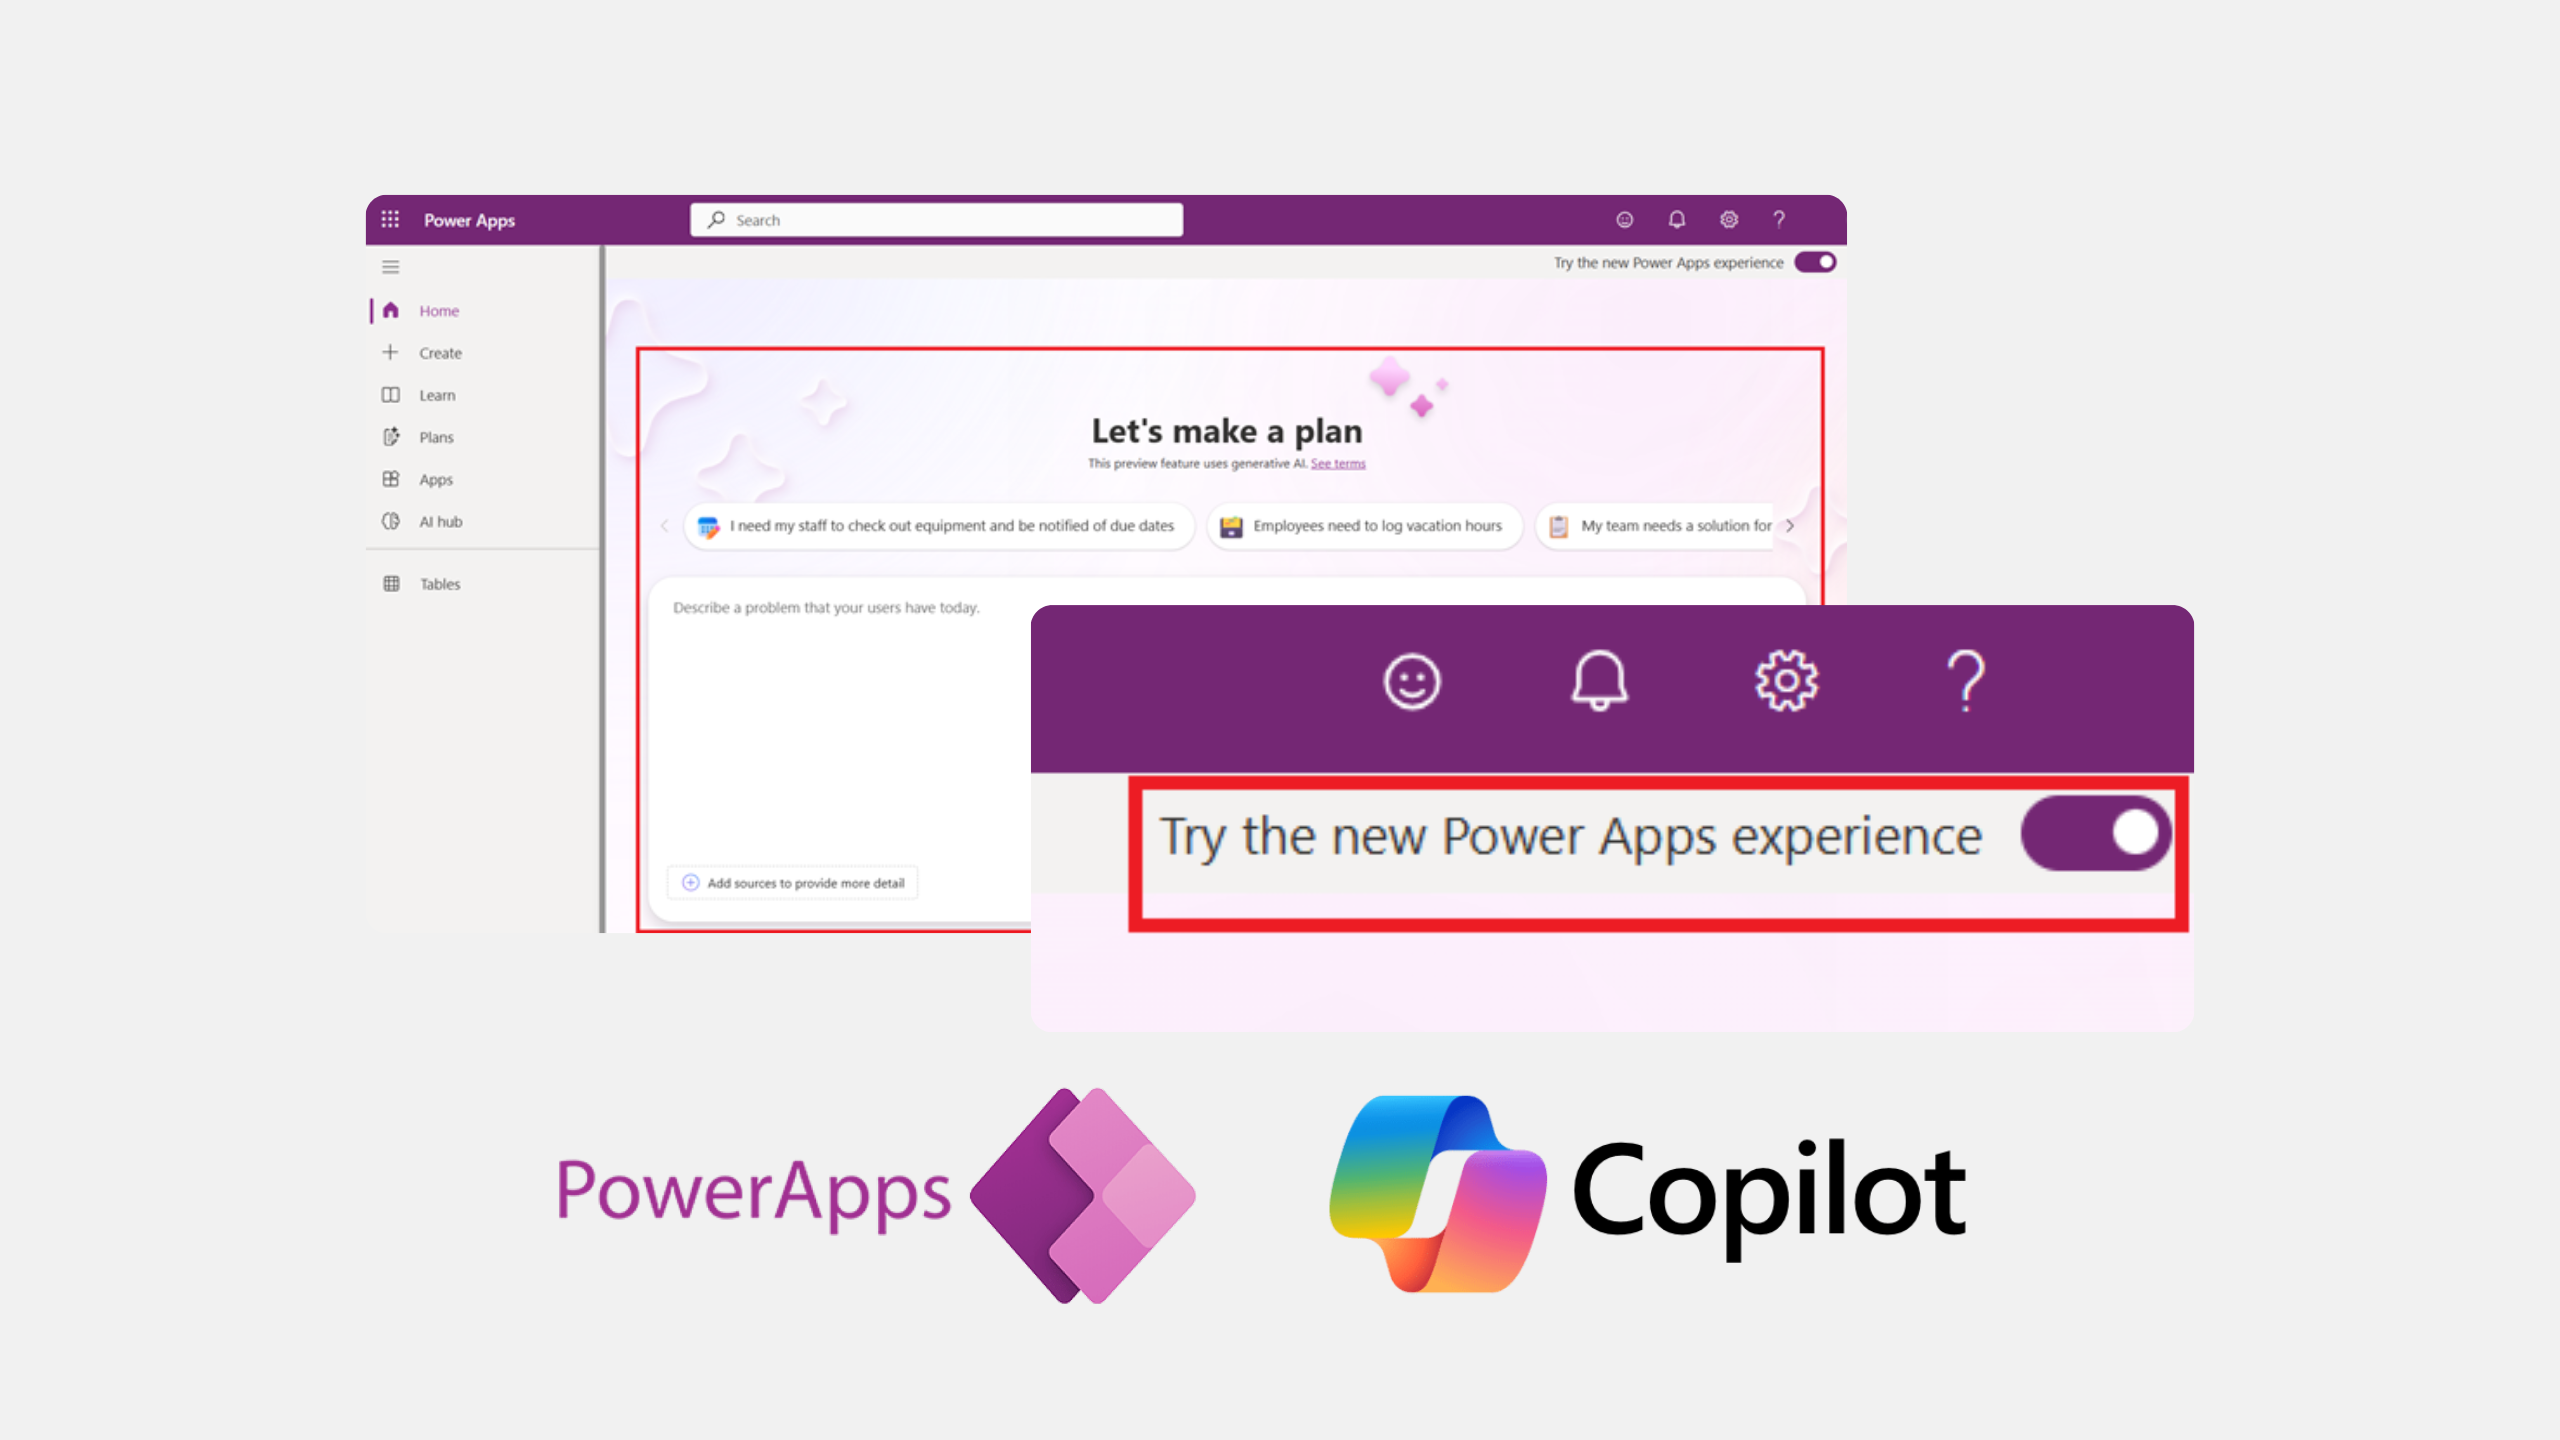
There's a new way to turn business ideas into app frameworks
Heading 1
Heading 2
Heading 3
Heading 4
Heading 5
Heading 6
Lorem ipsum dolor sit amet, consectetur adipiscing elit, sed do eiusmod tempor incididunt ut labore et dolore magna aliqua. Ut enim ad minim veniam, quis nostrud exercitation ullamco laboris nisi ut aliquip ex ea commodo consequat. Duis aute irure dolor in reprehenderit in voluptate velit esse cillum dolore eu fugiat nulla pariatur.
Block quote
Ordered list
- Item 1
- Item 2
- Item 3
Unordered list
- Item A
- Item B
- Item C
Bold text
Emphasis
Superscript
Subscript
How to Set Your Local Currency as the Default in Dynamics 365
Heading 1
Heading 2
Heading 3
Heading 4
Heading 5
Heading 6
Lorem ipsum dolor sit amet, consectetur adipiscing elit, sed do eiusmod tempor incididunt ut labore et dolore magna aliqua. Ut enim ad minim veniam, quis nostrud exercitation ullamco laboris nisi ut aliquip ex ea commodo consequat. Duis aute irure dolor in reprehenderit in voluptate velit esse cillum dolore eu fugiat nulla pariatur.
Block quote
Ordered list
- Item 1
- Item 2
- Item 3
Unordered list
- Item A
- Item B
- Item C
Bold text
Emphasis
Superscript
Subscript
Ready to talk about your use cases?
Request your free audit by filling out this form. Our team will get back to you to discuss how we can support you.
