


TL;DR
You don’t always need Copilot Studio to use Copilot in Power Platform. Microsoft is weaving generative features directly into tools like Power Apps and Power Automate. With generative pages, you can use natural language to build pages into your model-driven apps with unique functionality, skipping dozens of manual steps. It’s still early days but it already shows how Copilot is moving from optional add-on to everyday productivity layer inside the platform.
Ever wished Copilot could build your Power Platform pages for you?
Model-driven apps have always been structured and corporate, designed for consistency rather than flexibility. Custom pages (similarly to canvas apps) gave makers some creative freedom but building them often meant lengthy workarounds.
Generative pages change that balance. You can now describe what you need in plain English, and Copilot generates the page for you inside your model-driven app. What once required dozens of steps or complex canvas app design can now be spun up in minutes.
This is more than a convenience feature. It marks the way Copilot is flowing into the Power Platform ecosystem — not as a knowledge base lookup tool, but as a practical, embedded capability for app creation.
How to build your first app with Copilot in Power Platform
If you want to explore generative pages today, you’ll need to set up a US developer environment. The preview was announced on 21 July and, at the time of writing, is only available in the United States.
European users can experiment by creating a US environment, but they should only use data that is safe to leave EU boundaries. A full general availability release in Europe is expected in 2026, though dates are not yet confirmed in Microsoft’s release plans.
How to get started:
- Start with a model-driven app (see Microsoft’s step-by-step guide). Generative pages sit inside these apps, giving you a natural language way to add new functionality.
- Describe what you need in plain language — for example, “a form to capture customer onboarding details” or “a dashboard showing open cases by priority.” Copilot generates the layout, controls, and data bindings automatically.
- Refine and customise the page by adjusting fields, tweaking the layout, or modifying logic as you would with any other app component.
- Embed the page into your app by adding it to navigation, combining it with existing model-driven pages.
Think of the PCF as the “3D printer” for your LEGO set. Power Platform already gives you plenty of building blocks (low-code components you can drag and drop). If something is missing, PCF lets you design and build your own bespoke block, then slot it neatly into your app.
- Start using it. The output isn’t a mock-up or placeholder; it’s a functional page connected to your data model and ready to support your process.
Copilot for Power Automate
Copilot isn’t only helping with app building. In Power Automate, you can now create flows just by describing what you want in plain English.
Instead of adding every step manually, Copilot builds the flow for you. This makes it easier for newcomers to get started and saves time for experienced makers. You can find examples and details on Microsoft Learn.
What to keep in mind
- Early wave: These features are still in preview. Expect limitations, and don’t base production apps on them yet.
- Data residency: If you’re in Europe and experimenting with a US environment, only use non-sensitive data.
- Future availability: European general availability is expected in 2026, but plans are not final. Check the release plan site for updates.
- Governance still matters: Copilot may reduce effort, but it doesn’t remove the need for data quality, licensing checks, and proper lifecycle management.
What’s next in AI-assisted app design
We’re still at the start of the wave, but even now, you can create polished, functional applications in a fraction of the time and embed them directly into model-driven apps. Copilot will soon become part of everyday app-building in the Power Platform — no separate studio required.
Copilot isn’t just about generating text. It’s about rethinking how enterprise applications are designed and automated. And as these previews mature into general availability, the difference between long, complex builds and quick, AI-assisted development will only widen.
Curious how to adopt Copilot in your Power Platform environment today and prepare for what’s coming next? Get in touch with our experts and start shaping your roadmap.
TL;DR
Copilot Studio makes it possible for IT Ops and business teams to create custom AI agents that can answer questions, run processes, and even automate workflows across Microsoft 365. We recommend a structured approach: define the use case, create the agent, set knowledge sources, add tools and actions, then shape its topics and triggers. But before you dive into building, check your data quality, define a clear purpose, and configure the right policies.
Before you start setting anything up, stop
It’s tempting to open Copilot Studio and start dragging in tools, uploading files, and typing instructions. But an agent without a plan is just noise.
- Get your data in order first. Bad data means bad answers, and no amount of clever configuration can save it.
- Define the “why” before the “how.” Build around a specific use case. For example, sales support, finance queries, service troubleshooting.
- Don’t build for the sake of building. Just because you can spin up a chatbot doesn’t mean you should. The best agents are purposeful, not experimental toys.
Think of your agent as a new team member. Would you hire someone without a role description? Exactly.
Building your first Copilot: practical steps
Once you know the “why”, here’s how to get your first custom agent working.
1. Author clear instructions
Clear instructions are the foundation of your agent. Keep them simple, unambiguous, and aligned to the tools and data you’ve connected. Microsoft even provides guidance on how to write effective instructions.
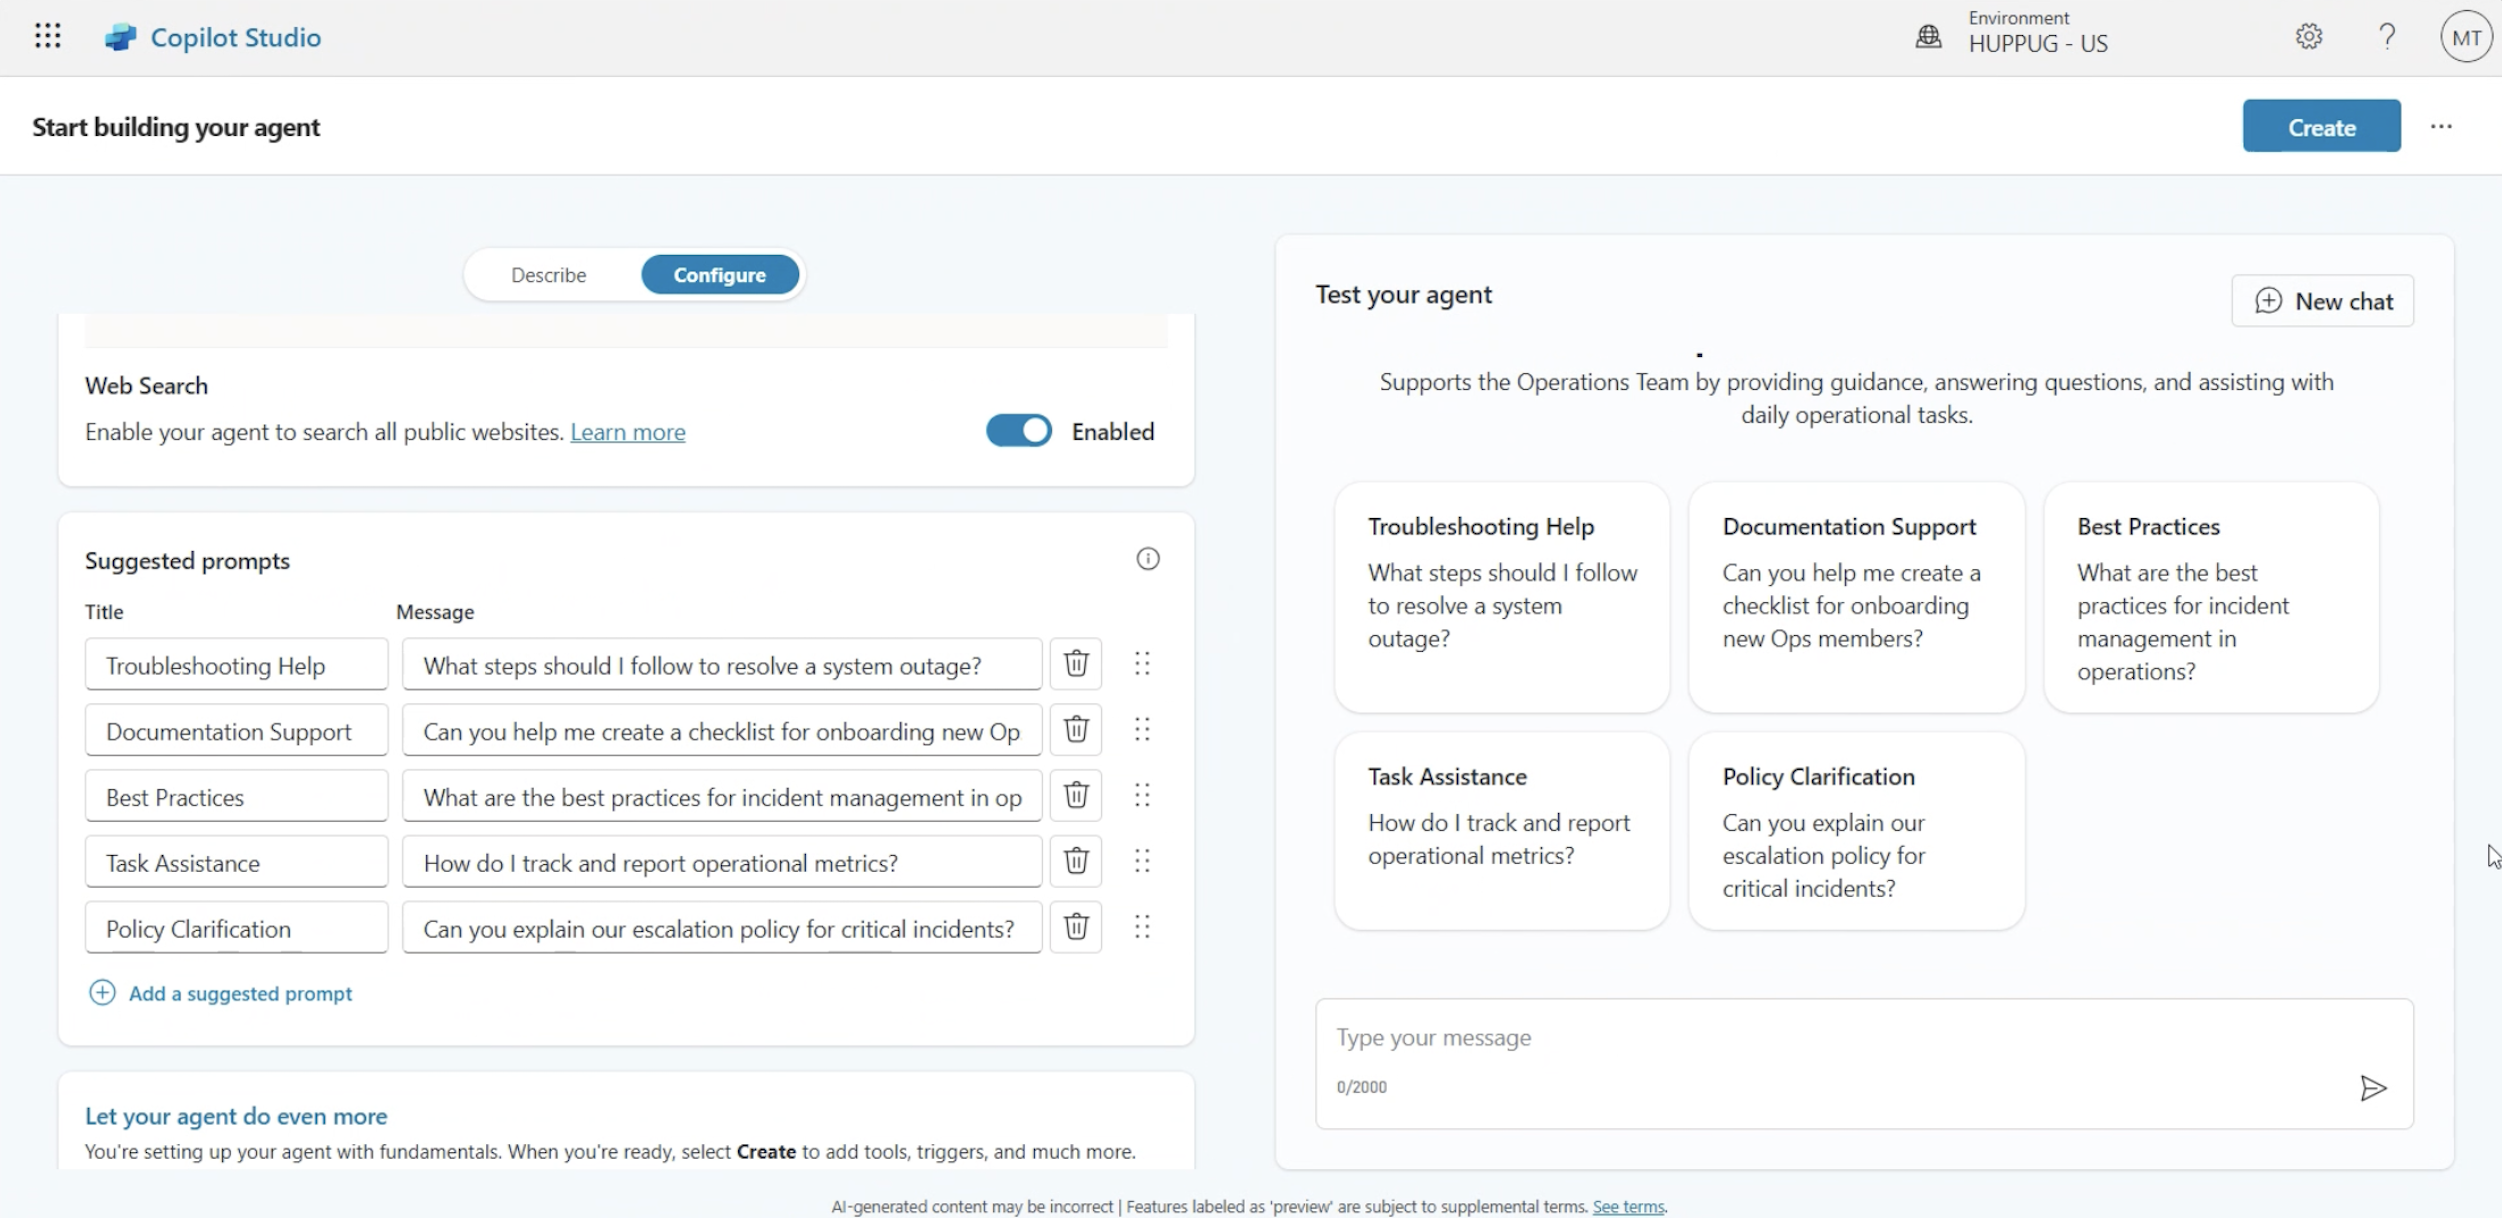
2. Configure your agent
- Content moderation: In the Agent → Generative AI menu, set rules for what your Copilot should (and shouldn’t) say. For example, if it can’t answer “XY”, define a safer fallback response.
- Knowledge sources: You can upload multiple knowledge sources, or add trusted public websites so the agent uses those instead of a blind web search.
- Add tools: Agents/Tools/Add a tool lets you extend functionality. For instance, connect a Meeting Management MCP server so your Copilot inherits scheduling skills without rebuilding them.
You’re not just configuring settings — you’re composing a system that reflects how your organisation works.
3. Validate your agent’s behaviour
As of now, there’s no automated testing of agents, but that doesn’t mean you should skip this step. You can manually test your agent as the author. The Copilot Studio test panel allows you to simulate conversations, trace which topics and nodes are activated, and identify unexpected behaviours. The panel is there to help you spot gaps, so take the time to run realistic scenarios before publishing.
4. Pick the right model
Copilot Studio now offers GPT-5 Auto (Experimental) alongside GPT-4.0 (default). The experimental model can feel sharper, but it may not reliably follow instructions. If stability matters more than novelty — and for most IT Ops rollouts it does — stick with 4.0 until you’re confident.
(As of 15th October, 2025. Note that model availability and behaviour may change over time).
The difference between noise and value
Rolling out a custom agent isn’t about dropping a chatbot into Teams. Done right, it’s about embedding AI into workflows where it drives real value — answering finance queries with authority, guiding service agents through processes, or combining AI with agent flows for end-to-end automation.
The difference between a useless bot and a trusted agent is preparation. Build with intent, configure with care, and test until you're sure it works properly.
You wouldn’t give a new hire access to your systems without training, policies, and supervision. Treat your AI agents the same way.
Need help automating workflows with Copilot Studio? Get in touch with our experts to discuss your use case.
TL;DR
Microsoft Fabric has become the fastest-growing product in Microsoft’s history in just 21 months. Its unification of previously fragmented tools, built-in real-time intelligence, AI-driven data agents, and full CI/CD support make it a turning point for users. Going forward, Fabric won’t be just another platform to support — it will be the foundation of enterprise data and AI. For IT Ops, that means shifting from fragmented support to proactive enablement, governance, and automation.
What problem is Fabric solving?
Historically, Microsoft’s data stack was a patchwork: Synapse for warehousing, Data Factory for pipelines, Stream Analytics for real-time, Power BI for reporting. Each had its own UI, governance quirks, and operational playbook.
Fabric consolidates that fragmentation into a single SaaS platform. Every workload — engineering, science, real-time, BI — runs on OneLake as its common storage layer. One data copy, one security model, one operational pillar. That means less time spent reconciling permissions across silos, fewer brittle integrations, and a clearer line of sight on performance.
How does real-time intelligence change the game?
Data platforms used to mean waiting until the next day for updates. Fabric resets these expectations. With Real-Time Intelligence built in, organisations can analyse telemetry, IoT, and application events as they happen — and trigger actions automatically.
For IT Ops, this changes monitoring from reactive to proactive. Anomaly detection and automated alerts are no longer bespoke projects; they’re native capabilities. The platform itself becomes part of the operations toolkit, surfacing issues and even suggesting resolutions before they escalate.
Is Fabric’s AI just Copilot?
So far, much of the AI conversation has centred on Copilot. But Fabric is pushing further, introducing data agents: role-aware, business-user-friendly assistants that can “chat with your data”.
This isn’t to replace analysts — the goal is to reduce bottlenecks. Business teams can query data directly, run sentiment analysis on CRM records, or detect churn patterns without submitting a ticket or waiting for a report build. IT Ops teams, in turn, can focus on platform health, governance, and performance, confident that access and security policies are enforced consistently.
How does Fabric fit into DevOps (DataOps) practices?
Fabric is closing the gap between data and software engineering. Every item, from a pipeline to a Power BI dataset, now supports CI/CD. GitHub integration is tightening, the Fabric CLI has gone open source, and the community is expanding rapidly.
For developers, this means fewer manual deployments, clearer audit trails, and the ability to fold Fabric artefacts into existing DevOps pipelines. Troubleshooting is also improving, with capacity metrics being redesigned for easier debugging and monitoring APIs opening new automation opportunities.
Why does this matter for IT operations going forward?
Fabric’s rapid progression is not just a vendor milestone. It signals a market demand for unified foundations, real-time responsiveness, AI-ready governance, and operational maturity.
As Fabric becomes the default data platform in the Microsoft ecosystem, IT operations will decide whether its promise translates into reliable, compliant, and scalable enterprise systems. From governance models to real-time monitoring to embedding Fabric into CI/CD, IT Ops will be the enabler.
What’s next for IT Ops with Fabric?
Fabric’s trajectory suggests it is on its way to becoming the operational backbone for AI-driven enterprises. For IT Ops leaders, the question is no longer if Fabric will be central, but how quickly they prepare their teams and processes to run it at scale.
Those who act early will position IT operations not as a cost centre, but as a strategic driver of enterprise intelligence.
Ready to explore how Microsoft Fabric can support your AI and data strategy? Contact our team to discuss how we can help you design, govern, and operate Fabric effectively in your organisation.
TL;DR:
Ops teams play a critical role in enabling citizen developers to build custom AI agents in Microsoft Copilot Studio. With natural language and low-code tools, non-technical staff can design workflows by simply describing their intent. The approach works well for structured processes but is less effective for complex file handling and multilingual prompts. To avoid compliance risks, high costs, or hallucinations, Ops teams must enforce guardrails with Data Loss Prevention, Purview, and Agent Runtime Protection Status. Adoption metrics, security posture, and clear business use cases signal when an agent is ready to scale. Real value comes from reduced manual workload and faster processes.
From chatbots to AI agents: lowering the barrier to entry
Copilot Studio has come a long way from its Power Virtual Agents origins. What was once a no-code chatbot builder has become a true agent platform that combines natural language authoring with low-code automation.
This shift means that “citizen developers” — business users, non-technical staff in finance, HR, or operations — can now design their own AI agents by simply describing what they want in plain English. For example:
“When an invoice arrives, extract data and send it for approval.”
Copilot Studio will automatically generate a draft workflow with those steps. Add in some guidance around knowledge sources, tools, and tone of voice, and the result is a working agent that can be published in Teams, Microsoft 365 Copilot, or even external portals.
This lowers the barrier to entry, but it doesn’t remove the need for structure, governance, and training. That’s where the Ops team comes in.
Good to know: Where natural language works — and where it doesn’t
The AI-assisted authoring in Copilot Studio is powerful, but it has limits. Citizen developers should know that:
- Strengths: Natural language works well for structured workflows and simple triggers (“if an RFP arrives, collect key fields and notify procurement”).
- Weaknesses: File handling is still a challenge. Unlike M365 Copilot or ChatGPT, Copilot Studio agents are not yet great at tasks like “process this document and upload it to SharePoint” purely from natural language prompts. These scenarios require additional configuration.
- Localisation gaps: Native Hungarian (and many other languages) aren’t yet supported, so prompts must be translated to English first — with the risk of losing substance.
For Ops teams, this means setting realistic expectations with business users and stepping in when agents need to move from prototype to production.
Setting guardrails: governance, security, and compliance
Citizen development without governance can quickly become a compliance risk — or result in unexpected costs. Imagine a team lowering content moderation to “low” and publishing an agent that hallucinates, uses unauthorised web search, or leaks sensitive data.
To prevent these scenarios, Ops teams should establish clear guardrails:
- Train citizen developers first on licenses, costs, knowledge sources, and prompting.
- Apply DLP policies — Power Platform Data Loss Prevention rules can extend into Copilot Studio, preventing risky connectors or external file sharing.
- Leverage Microsoft Purview to enforce compliance and detect policy violations across agents.
- Check Monitor Protection Status — each Copilot Studio agent displays a real-time security posture, flagging issues before they escalate.
- Define a governance model — centralised (Ops reviews every agent before publishing) or federated (teams experiment, Ops provides oversight). For organisations new to citizen development, centralised control is often the safer path.
The goal is to strike the right balance: empower citizen developers, but ensure guardrails keep development secure and compliant.
Scaling and adoption: knowing when to step in
Citizen-built agents can add value quickly, but Ops needs to know when to take over. Some key signs:
- Adoption metrics — Copilot Studio provides data on engagement, answer quality, and effectiveness scores. If an agent is gaining traction, it may need Ops support to harden and scale.
- Security posture — monitoring Protection Status helps Ops see when an agent needs adjustments before wider rollout.
- Clear use case fit — when a team builds an agent around a defined business process (invoice approval, employee onboarding), it’s a good candidate to formalise and extend.
Ops teams should also set up lifecycle management and ownership frameworks to avoid “shadow agents” that nobody maintains.
How to measure the real value of custom agents
Metrics like adoption, effectiveness, and engagement tell part of the story. But the real measure of success is whether agents help reduce manual workload, accelerate processes, and cut costs.
For example:
- Does the HR onboarding agent save time for hiring managers?
- Does the finance approval agent speed up invoice processing and payment approvals?
- Is there a reduction in number of tickets that Ops teams have to handle because business users solve their needs with agents?
These qualitative outcomes matter more than raw usage stats — and Ops is best positioned to track them.
Takeaways for Ops teams
Enabling citizen developers in Copilot Studio is all about finding the right balance. You want to give business users the freedom to experiment with natural language tools and ready-made templates. At the same time, it helps to teach them the basics — how to prompt effectively, what knowledge sources to use, and even what the licensing costs look like.
Of course, freedom comes with responsibility. That’s why Ops needs to set guardrails through DLP, Purview, and centralised reviews. And as agents start getting real traction, it’s important to keep an eye on adoption metrics so you know when a quick experiment is ready to be treated as an enterprise-grade solution.
When you get this balance right, it becomes a scalable and secure way for the business to automate processes — with Ops guiding the journey rather than standing in the way.
Ready to see how Copilot Studio could empower your teams? Get in touch with our experts and discuss your use case!

TL;DR:
Scaling AI isn’t just about the model — it’s about the data foundation. Without a unified, modern platform, most AI projects stay stuck in pilot mode. At the recent Microsoft Fabric Conference, we saw firsthand how Fabric delivers that missing foundation: one copy of data, integrated analytics, built-in governance, and AI-ready architecture. The results are faster scaling, higher accuracy, and greater ROI from AI investments.
The illusion of quick wins with AI
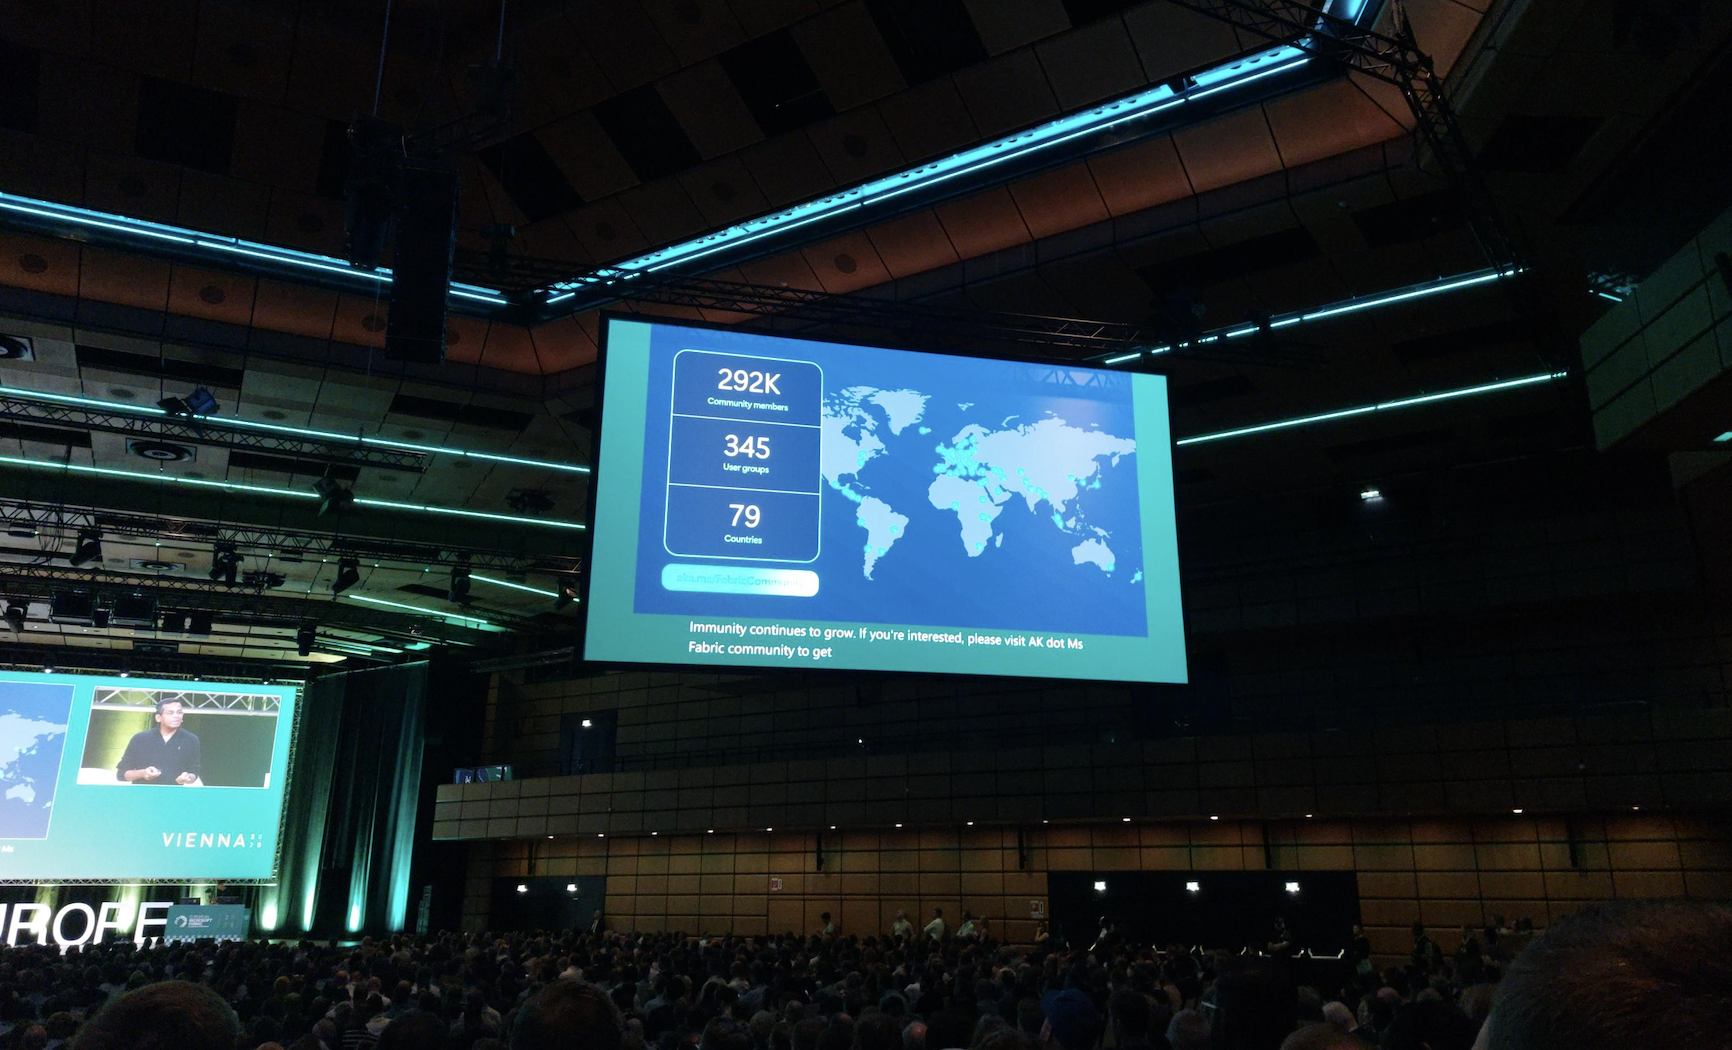
Last week, our team attended the Microsoft Fabric Conference in Vienna, where one theme came through loud and clear: AI without a modern data platform doesn’t scale.
It’s a reality we’ve seen with many organisations. AI pilots often succeed in a controlled environment — a chatbot here, a forecasting model there — but when teams try to scale across the enterprise, projects stall.
The reason is always the same: data. Fragmented, inconsistent, and inaccessible data prevents AI from becoming a true enterprise capability. What looks like a quick win in one corner of the business doesn’t translate when the underlying data foundation can’t keep up.
The core problem: data that doesn’t scale
For AI initiatives to deliver value at scale, organisations typically need three things in their data:
- Volume and variety — broad, representative datasets that capture the reality of the business.
- Quality and governance — data that is accurate, consistent, and compliant with policies and regulations.
- Accessibility and performance — the ability to access and process information quickly and reliably for training and inference.
Yet in many enterprises, data still lives in silos across ERP, CRM, IoT, and third-party applications. Legacy infrastructure often can’t handle the processing power that AI requires, while duplicated and inconsistent data creates trust issues that undermine confidence in outputs.
On top of that, slow data pipelines delay projects and drive up costs. These challenges explain why so many AI initiatives never move beyond the pilot phase.
The solution: a modern, unified data platform
A modern data platform doesn’t just centralise storage — it makes data usable at scale.That means unifying enterprise and external data within a single foundation, ensuring governance so information is clean, secure, compliant, and reliable by default.
It must also deliver the performance required to process large volumes of data in real time for demanding AI workloads, while providing the flexibility to work with both structured sources like ERP records and unstructured content such as text, images, or video.
This is exactly the gap Microsoft Fabric is built to close.
Enter Microsoft Fabric: AI’s missing foundation
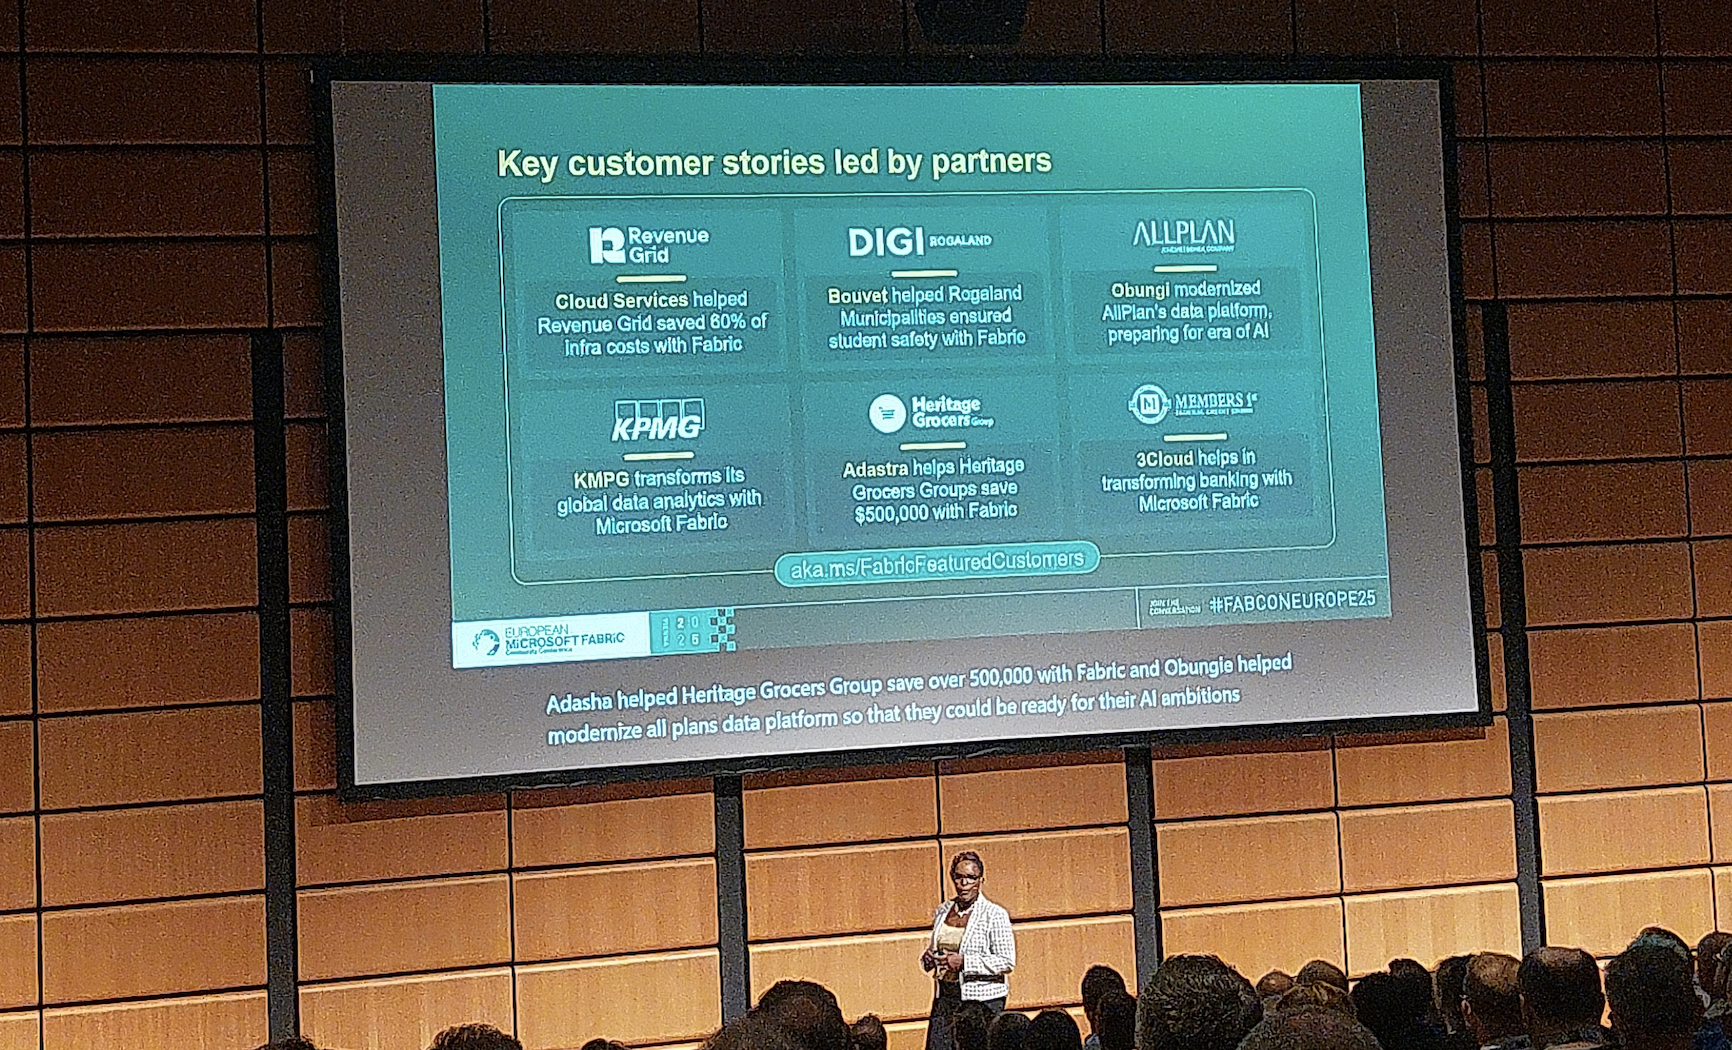
At the conference, we heard repeatedly how Fabric is turning AI projects from disconnected experiments into enterprise-scale systems.
Fabric isn’t a single tool. It’s a complete data platform designed for the AI era — consolidating capabilities that used to require multiple systems:
- OneLake, one copy of data — no duplication, no confusion; store once, use everywhere.
- Integrated analytics — data engineering, science, real-time analytics, and BI in one platform.
- Built-in governance — security, compliance, and lineage embedded by design.
- AI-ready architecture — seamless with Azure ML, Copilot, and Power Platform.
- Dataverse + Fabric — every Dataverse project is now effectively a Fabric project, making operational data part of the analytics foundation.
- Improved developer experience — new features reduce friction and make it easier to turn raw data into usable insights.
- Agentic demos — highlight why structured data preparation is more critical than flashy models.
- Fabric Graph visualization — reveals relationships across the data landscape and unlocks hidden patterns.
The business impact
The message is clear: Fabric isn’t just a data tool — it’s the foundation that finally makes AI scale.
Early adopters of Fabric are already seeing results:
- 70% faster data prep for AI and analytics teams.
- Global copilots launched in months, not years.
- Lower infrastructure costs thanks to one copy of data instead of endless duplication.
Make your AI scalable, reliable, and impactful with Microsoft Fabric
AI without a modern data platform is fragile. With Microsoft Fabric, enterprises move from isolated pilots to enterprise-wide transformation.
Fabric doesn’t just modernise data. It makes AI scalable, reliable, and impactful.
Don’t let fragile data foundations hold back your AI strategy. Talk to our experts to explore how Fabric can unlock AI at scale for your organisation.
TL;DR:
Legacy ERP workflows rarely map cleanly into Dynamics 365. Familiar screens, custom approvals, patched permissions often break because Dynamics 365 enforces a modern, role-based model with standardised navigation and workflow logic. This isn’t a bug but the natural result of moving from heavily customised systems to a scalable platform. To avoid adoption failures, don’t replicate the old system screen by screen. Focus on what users actually need, rebuild tasks with native Dynamics 365 tools, redesign security around duties and roles, and test real scenarios continuously. Migration is your chance to modernise, and if you align workflows with Dynamics 365 patterns, you’ll gain a system that’s more secure, more scalable, and better suited to how your business works today.
Why your ERP workflows fail after migration
You’ve migrated the data. You’ve configured the system. But now your field teams are stuck.
They can’t find the screens they used to use. The approvals they rely on don’t trigger. And the reports they count on? Missing key data.
This isn’t a technical glitch. It’s a user experience mismatch.
When companies move from legacy ERP systems to Dynamics 365, the shift isn’t just in the database. The entire way users interact with the system changes, from navigation paths and field layouts to permission models and process logic.
If you don’t redesign around those changes, your ERP transformation will quietly break the very workflows it was meant to improve.
This is the fourth part of our series on ERP data migration. In our previous posts, we covered:
- Our step-by-step playbook for successful ERP migration
- Why your ERP migration is delayed and how to speed it up without sacrificing quality
- Why bad data breaks ERP and what to do about it
Dynamics 365 isn’t your old ERP — and that’s the point
Legacy systems were often customised beyond recognition. Buttons moved, fields were renamed, permissions manually patched. As a result, they were highly tailored systems that made sense to a small group of users but were nearly impossible to scale or maintain.
Dynamics 365 takes a different approach. It offers a modern, role-based experience that works consistently across modules. But that means some of your old shortcuts, forms, and approvals won’t work the same way — or at all.
This can catch users off guard. Especially if no one has taken the time to explain why the system changed, or to align the new setup with how teams actually work.
Where the breakage usually happens
Navigation
Field engineers can’t find the work order screens they’re used to. Finance can’t locate posting profiles. Procurement doesn’t know how to filter vendor invoices. Familiar menus are gone and replaced with new logic that’s more powerful, but also less intuitive if you’re coming from a heavily customised legacy system.
Permissions
Old ERPs often relied on manual access grants or flat permission sets. In Dynamics 365, role-based security is more structured, and less forgiving. If roles aren’t mapped correctly, users lose access to critical features or gain access they shouldn’t have.
Workflow logic
Your old approval chains or posting setups may not map cleanly to Dynamics 365. For example, workflow conditions that relied on specific field values may behave differently now, or require reconfiguration using the new workflow engine.
Day-to-day tasks
Sometimes it’s as simple as a missing field or a renamed dropdown. But that can be enough to stall operations if users aren’t involved in the migration process and given time to learn the new flow.
How to avoid workflow disruption in your Dynamics 365 migration
Don’t try to copy the old system screen for screen. That’s a common mistake and it leads to frustration. Instead, map legacy processes to Dynamics 365 patterns. Focus on what the user is trying to achieve, not what the old screen looked like.
Start with your core user tasks.
- What does a finance user need to do each day?
- What about warehouse staff?
- Field service engineers?
Identify their critical workflows, then rebuild them in Dynamics 365 using native forms, views, and automation.
Review and rebuild your security model. Role-based security is at the heart of Dynamics 365. You’ll need to define duties, privileges, and roles properly, not just copy old access tables. Test for least privilege and ensure segregation of duties.
Test user scenarios in every sprint. Don’t wait for UAT to catch usability issues. Include key personas in each migration cycle. Run scenario-based smoke tests and regression checks. Use test environments that mirror production, and validate real-life tasks end to end.
Provide context and support. Users aren’t just learning a new tool — they’re changing habits built over years. Train them with use-case-driven sessions, not generic walkthroughs. Show them how the new process works and why it changed.
The takeaway is: Migration is your chance to modernise — don’t waste it
Your ERP isn’t just a backend system. It’s where users spend hours every day getting work done. If it doesn’t work the way they expect, adoption will suffer, and so will your transformation goals.
✅ Legacy workflows may not map to D365 one-to-one
✅ Navigation, permissions, and logic will differ
✅ Redesign processes around D365 patterns, not legacy layouts
✅ Review role-based permissions carefully
✅ Involve users early and test real scenarios every sprint
Done right, this isn’t just damage control. It’s an opportunity to rebuild your processes in a way that’s more secure, more scalable, and actually aligned with how your business works today.
Just because your old system lets you do something doesn’t mean its how your new system should work — and now’s the perfect time to make that shift. Consult our experts before you begin your migration and set the project up for success.
