


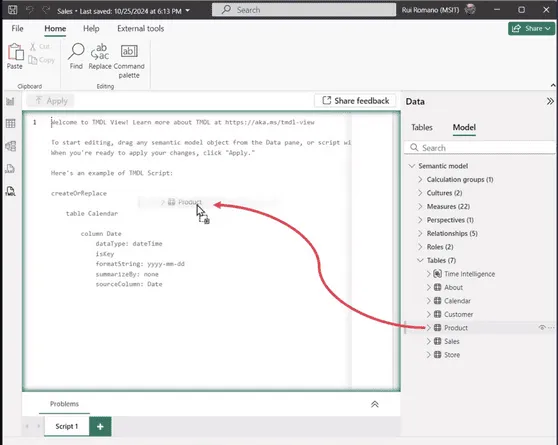


In part 3, I’m going to give you a step-by-step description of the implementation process of source control in Power BI. This can be divided into 4 parts:
- Modify settings in Power BI Desktop
- Download & Install necessary softwares
- Set up environments
- Use it!
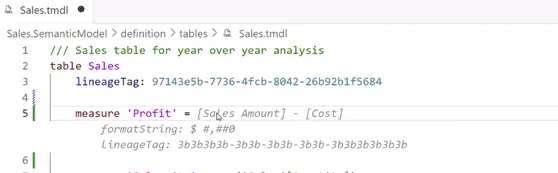
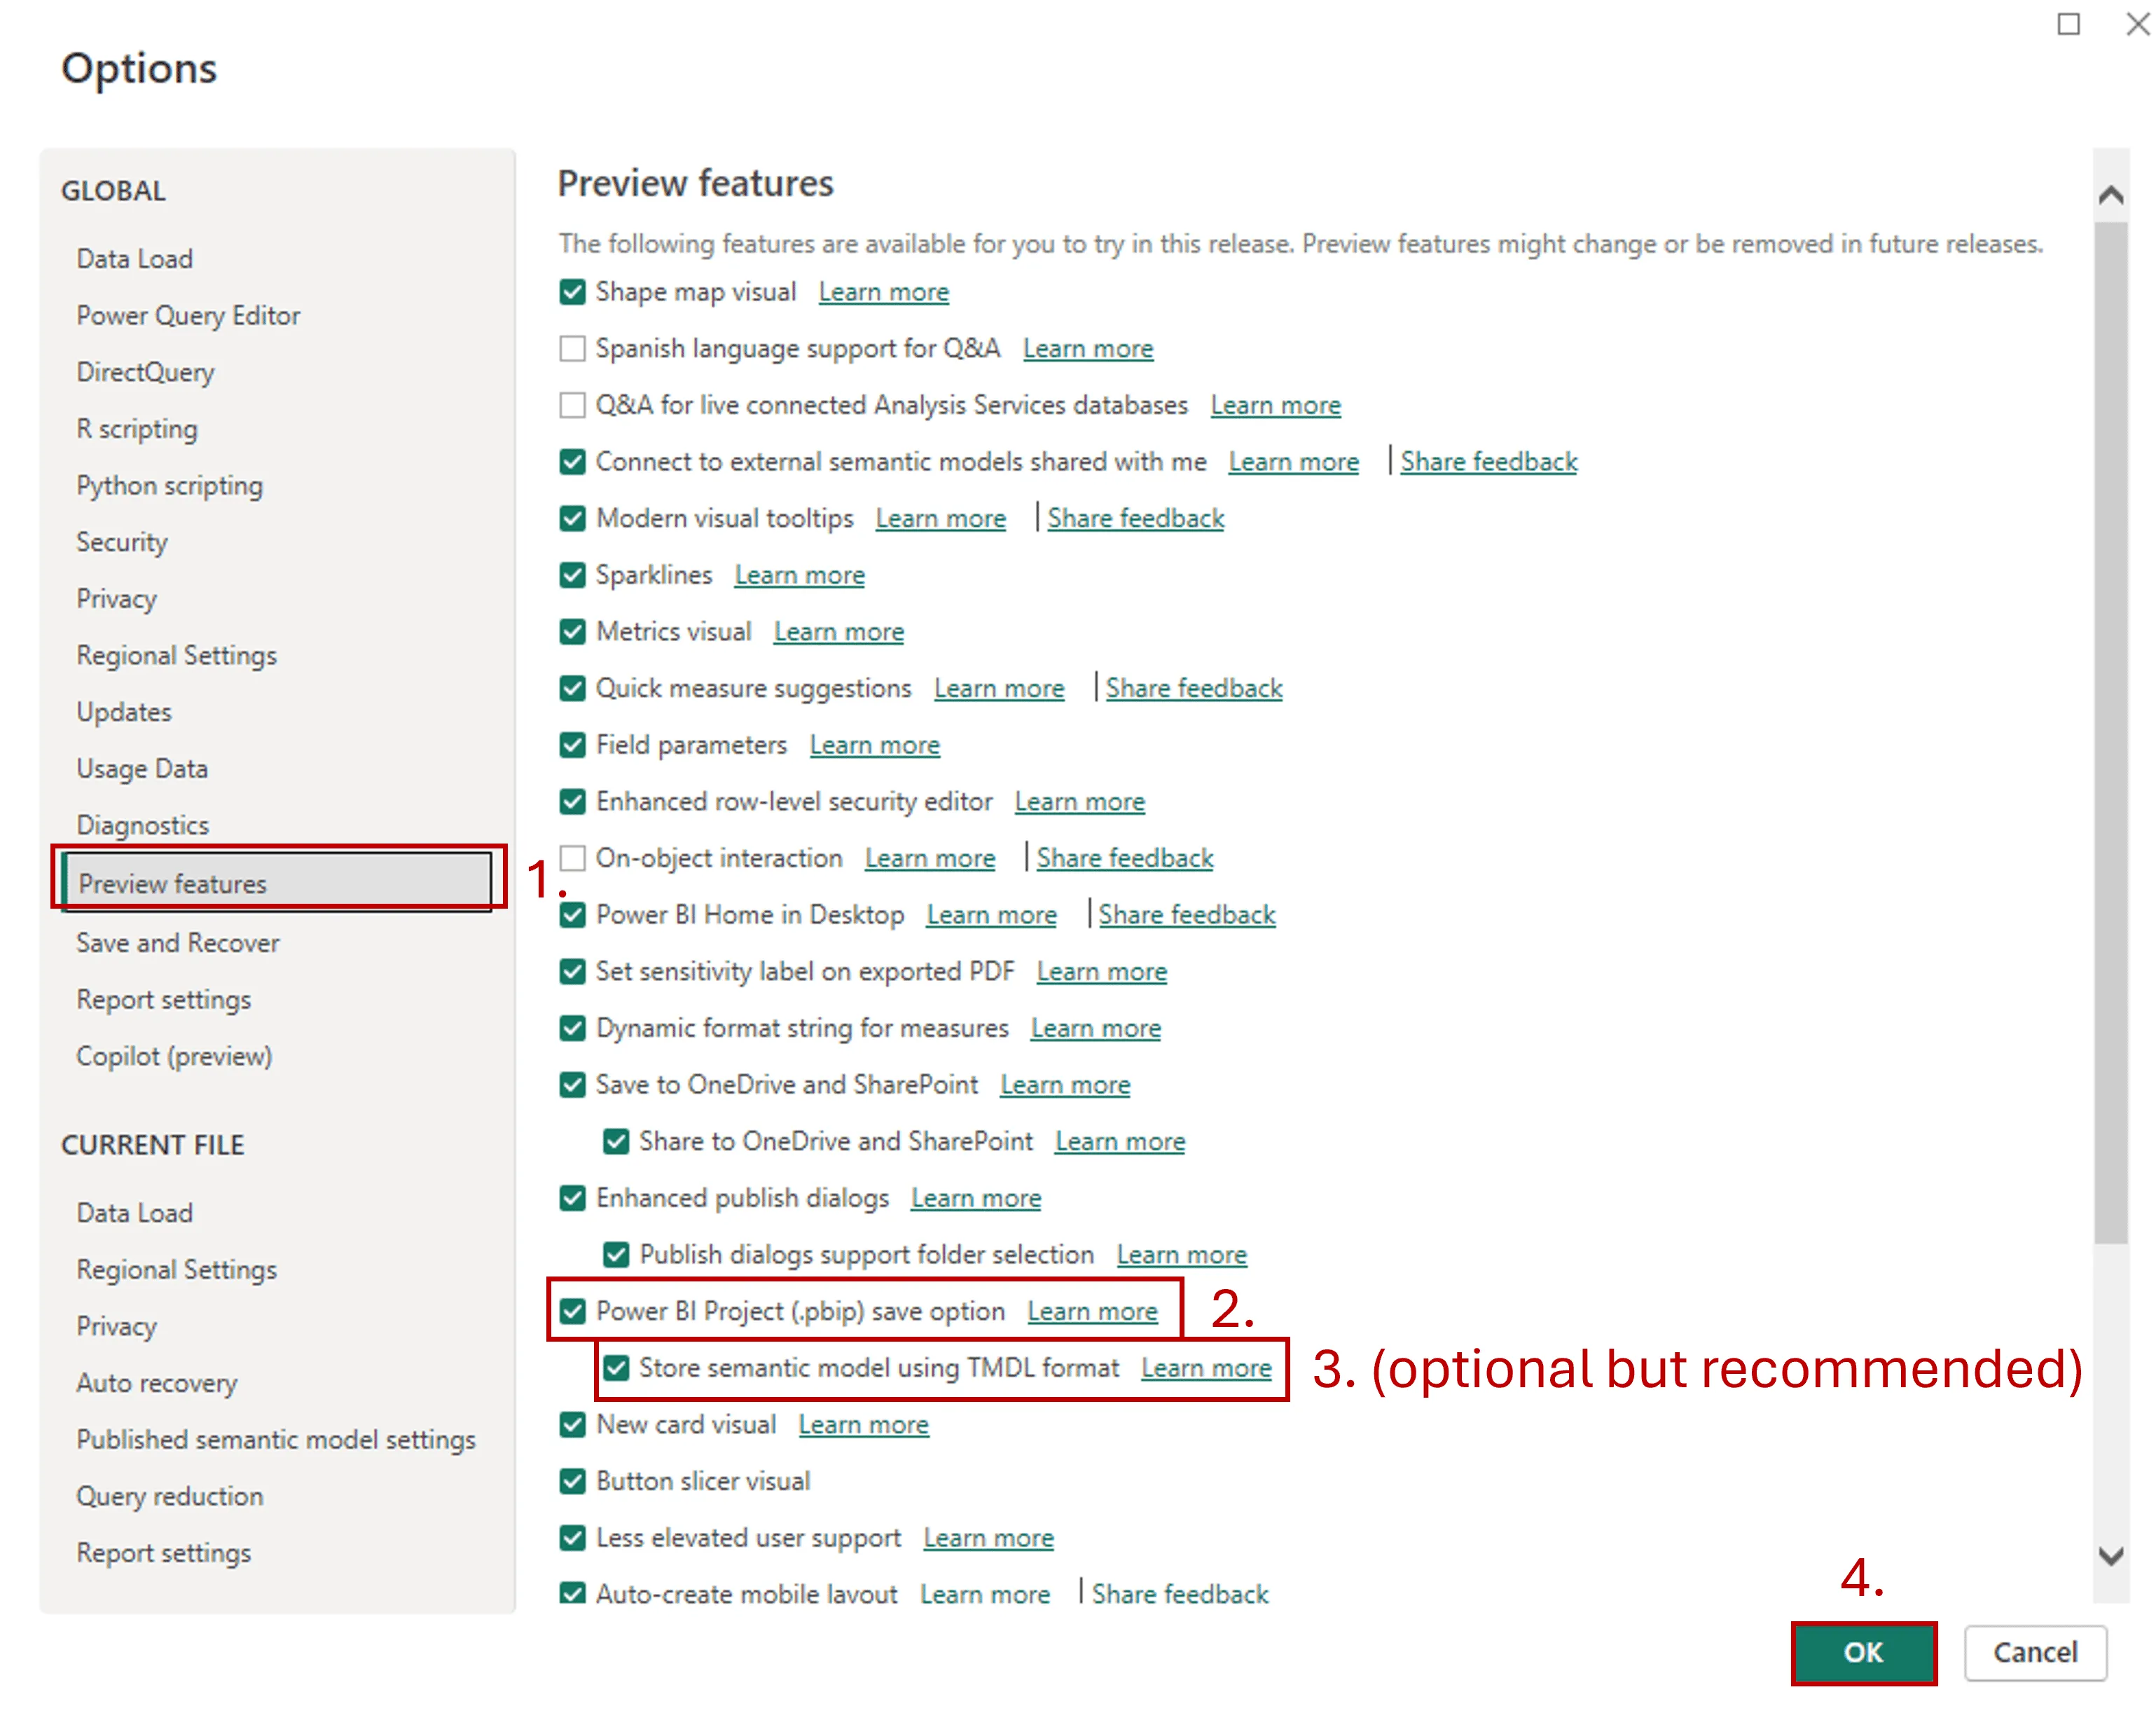
Step 1 - Modify settings in Power BI Desktop: Enable preview feature: Power BI Project (*.pbib) save option
- Open Power BI Desktop
- Go to Options and settings and select Options

3. Click on Preview features and enable Power BI Project (*.pbib) save option +1 optional) I’d recommend ticking the boksz next to Store semantic model using TMDL format 4.Hit OK
And now we can move to Step 2. Step 2 - Download & Install necessary softwares At VisualLabs we decided to use VS Code but you can do the basics in Power Shell as well. The reason I prefer VS Code is that you can have a visual interpretation of your project (track all the branches, merges, etc at the same time).
- Download and install VS Code - https://code.visualstudio.com/download
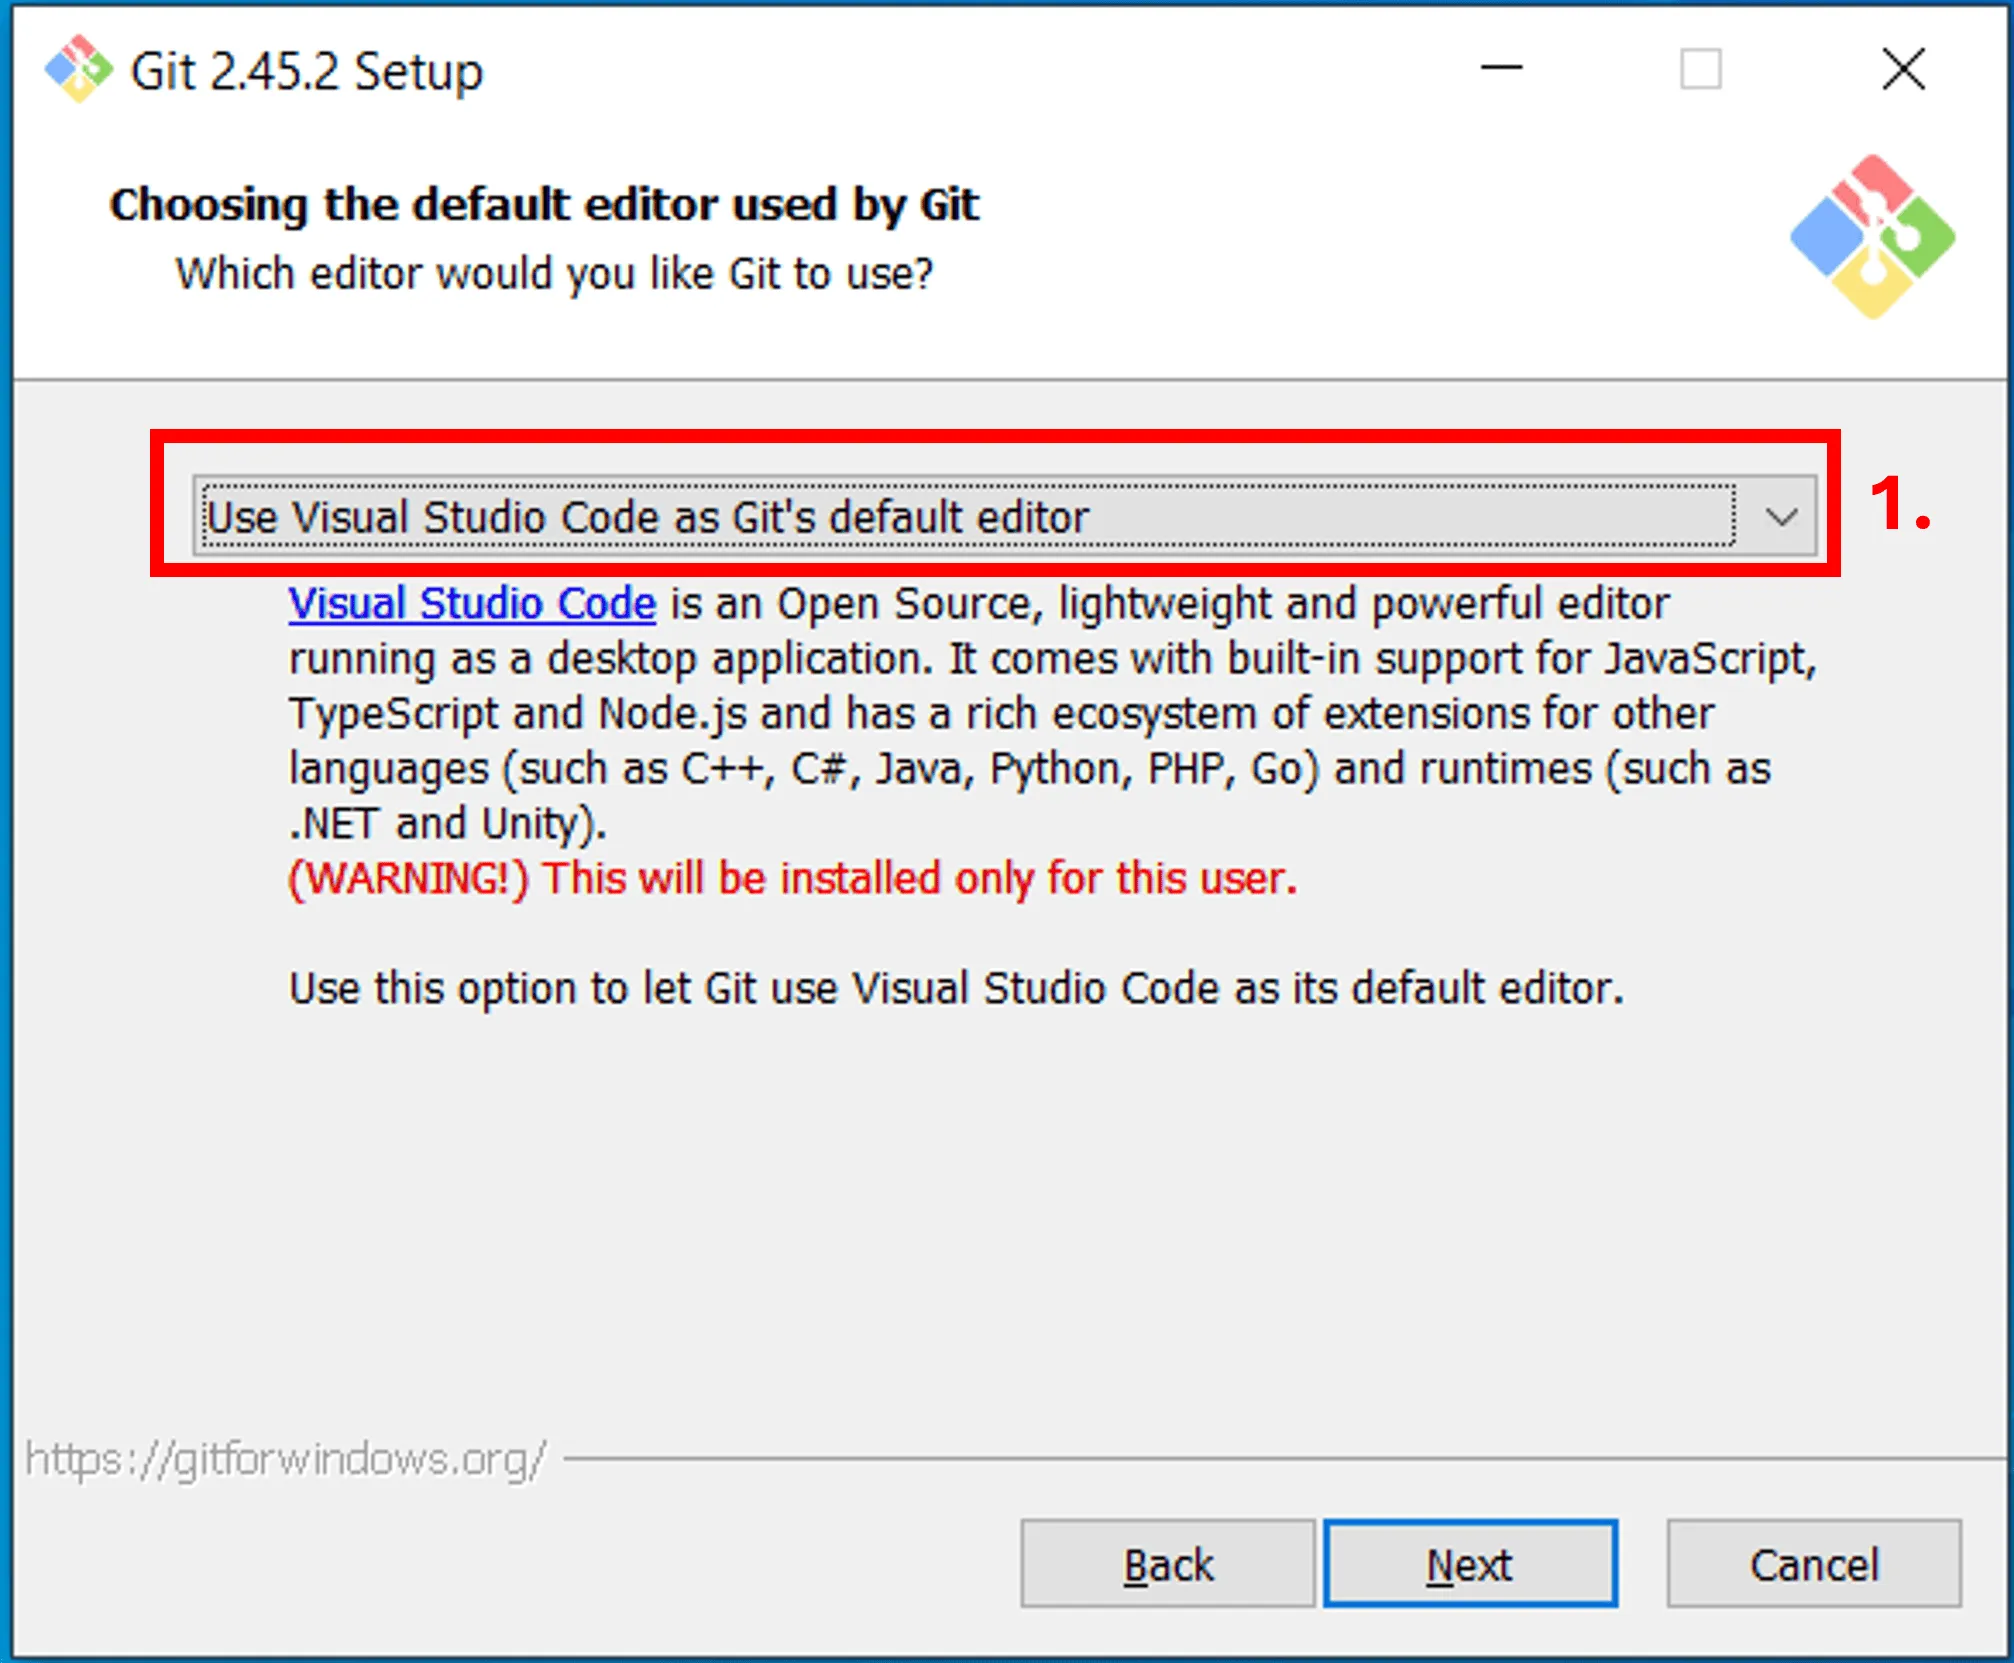
Feel free to install it with the default settings. 2. Download and install GIT. You can download it from here: https://www.git-scm.com/downloads Feel free to install it with the default settings, the only thing you can change is the default editor, which you can set to Visual Studio Code.
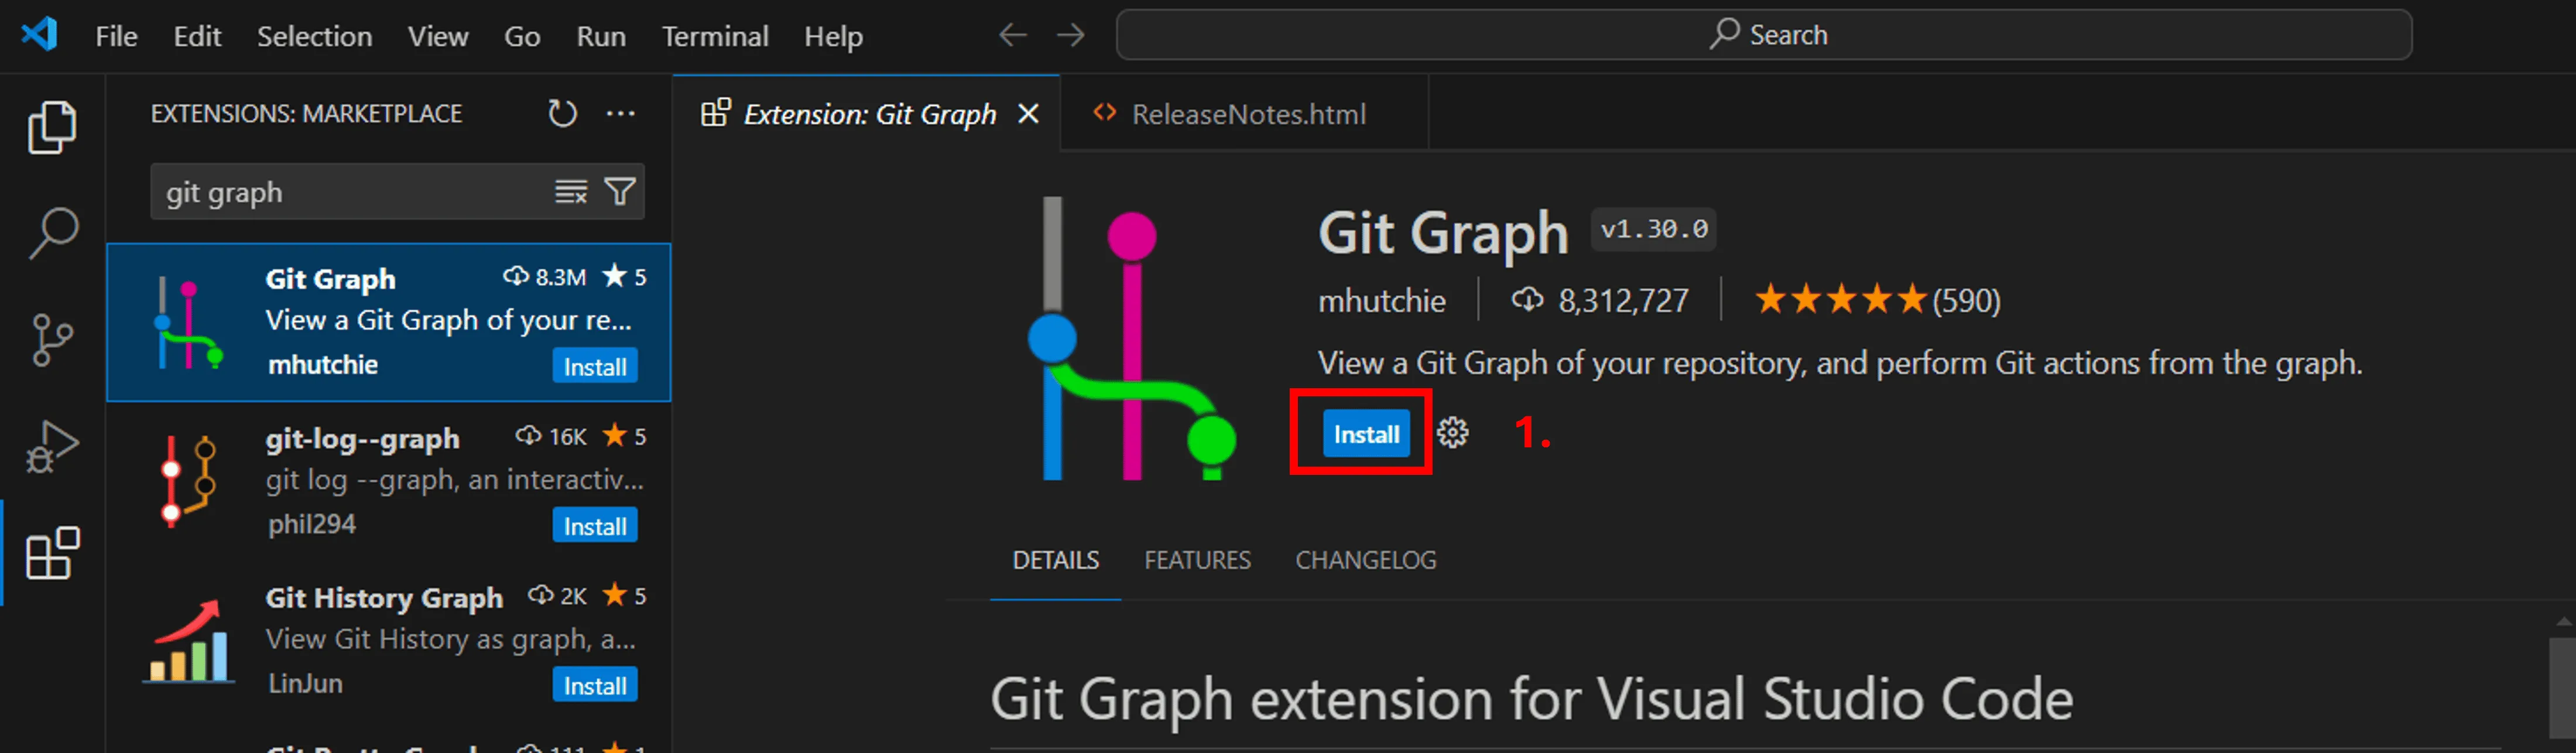
3. Add GitGraph to VS Code – this will allow you to see the historical changes of your repo as mentioned above.
- Open VS Code
- Click on Extension on the right
- Type Git graph
- Select from list
- Click Install
Step 3 – Set up GIT and Azure DevOps environments
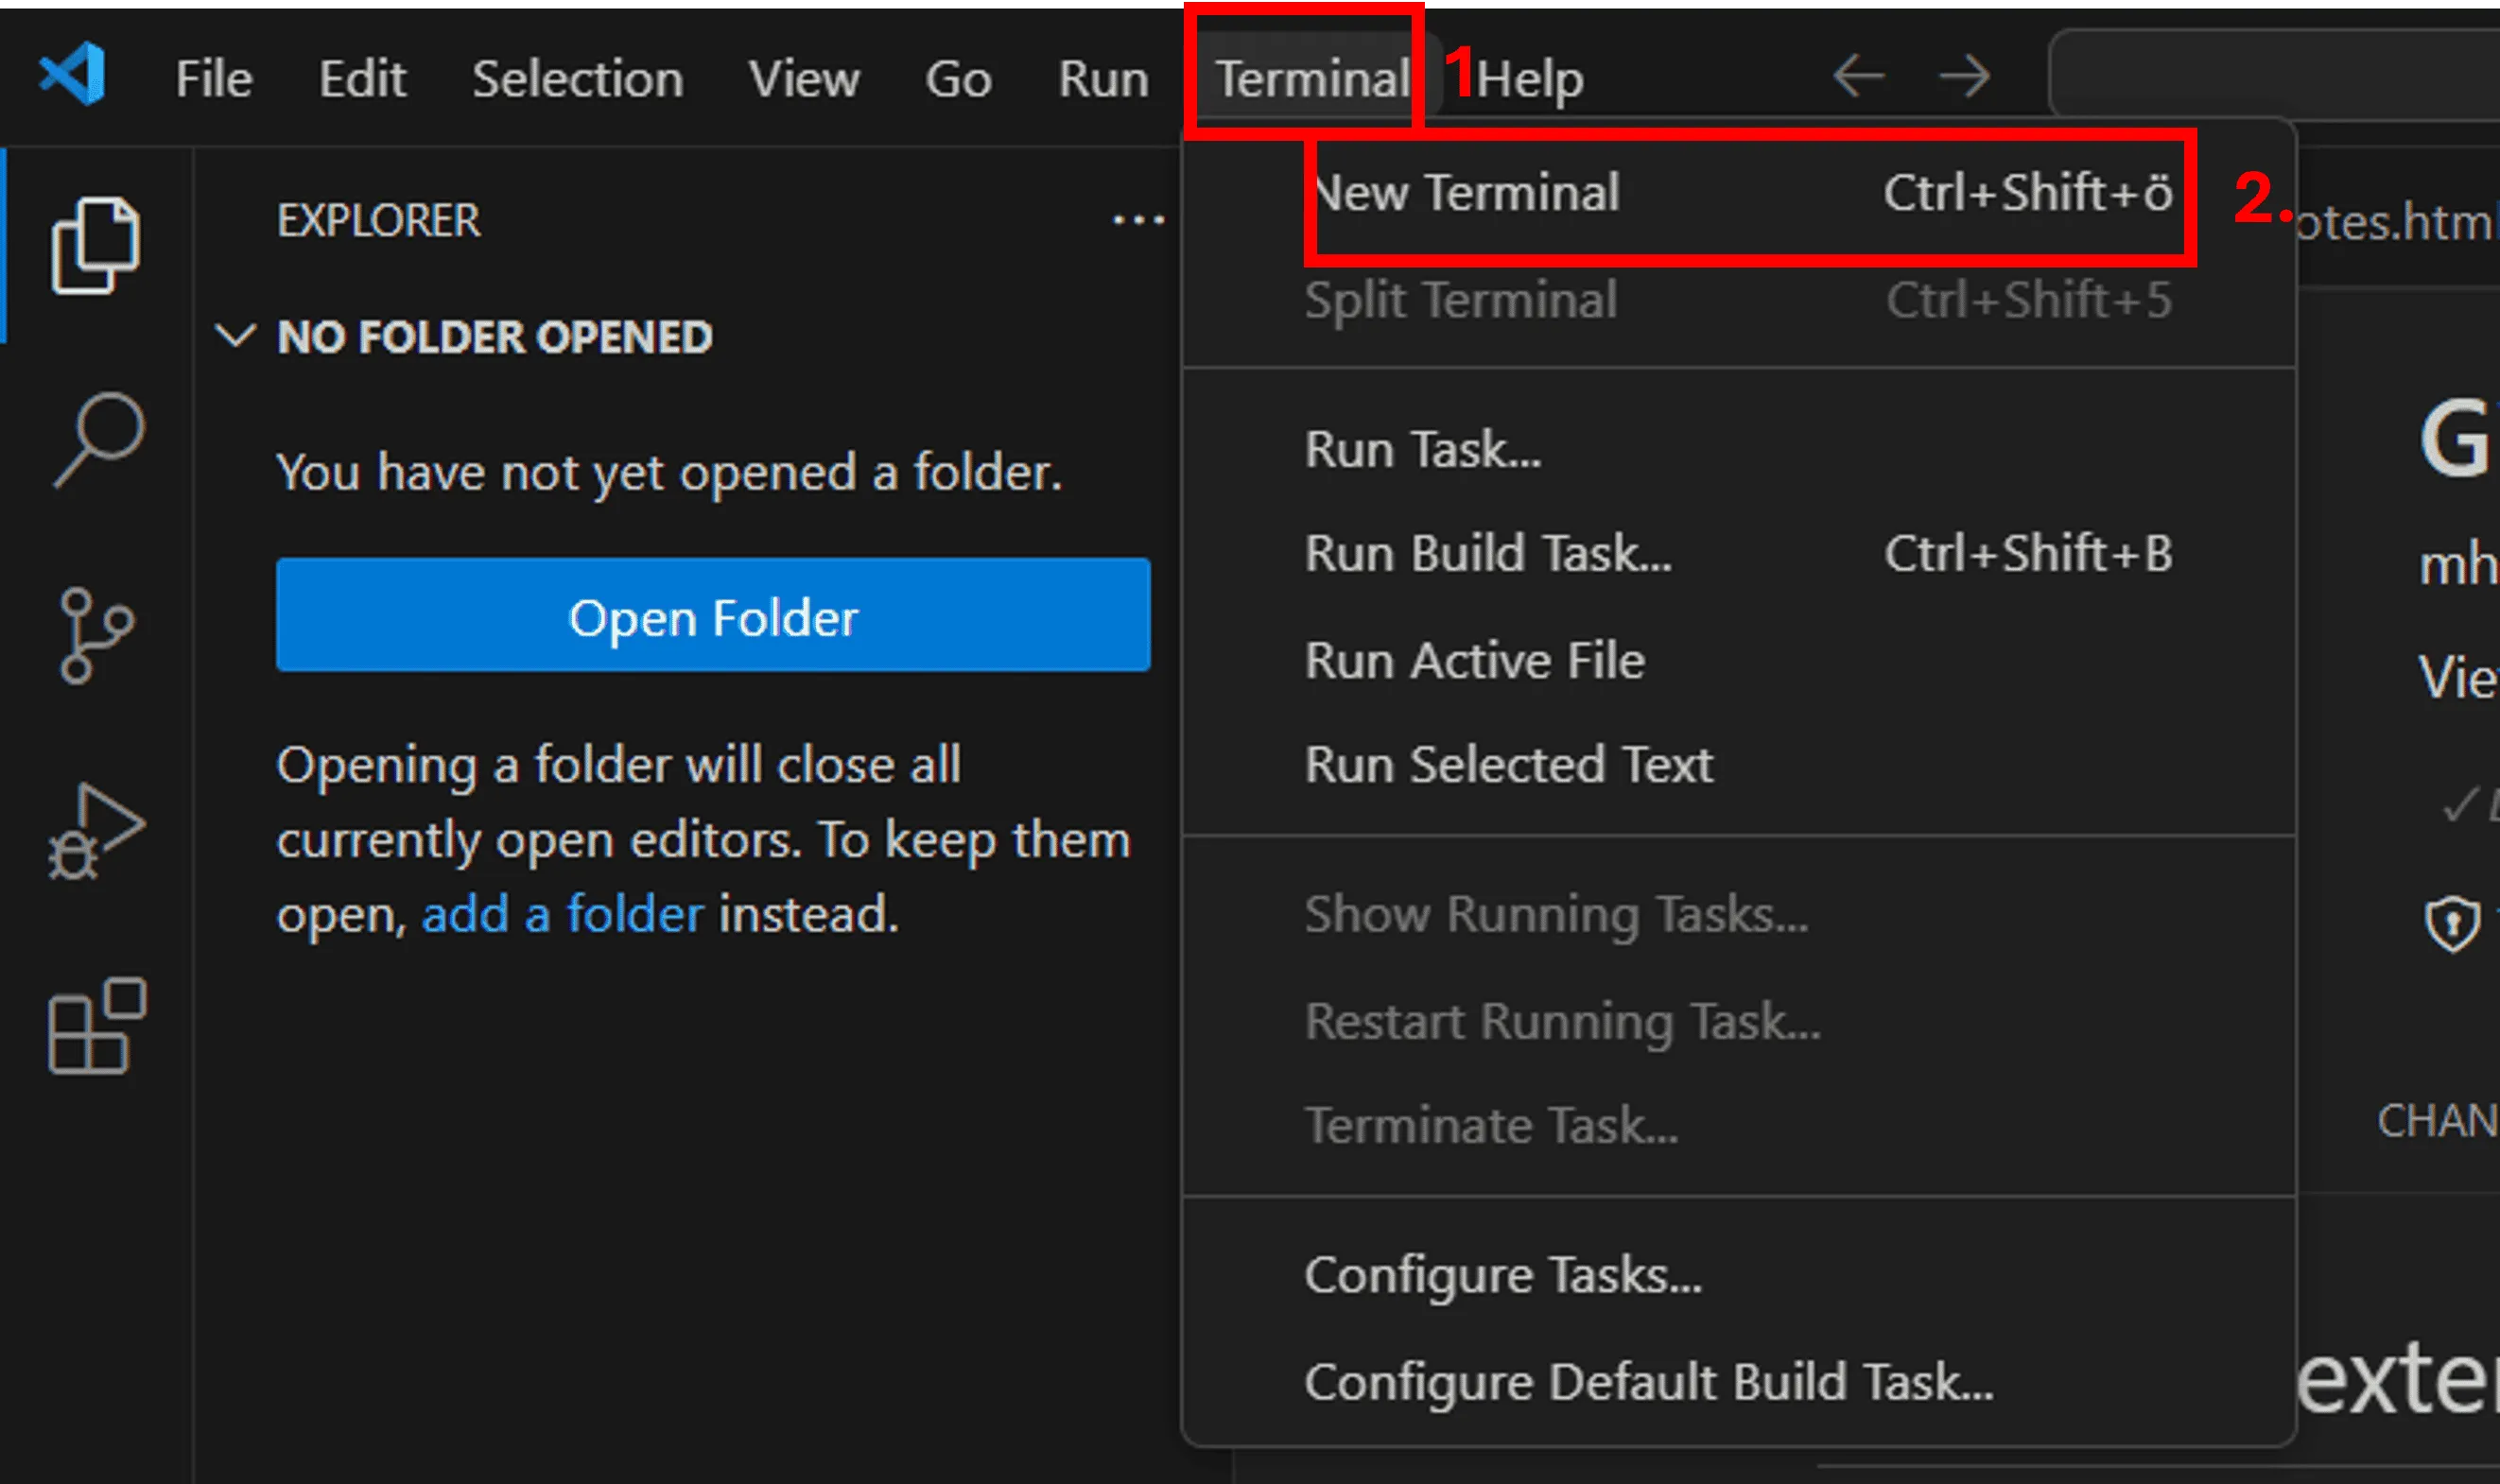
- Set up VS Code as your default GIT editor - Open a New Terminal in VS Code and type this command (you may need to restart you VS Code or machine to make the commands work properly):
git config --global core.editor "code --wait"
Set up your GIT Identity – type this command in the terminal git config --global user.name "FirstName LastName" git config --global user.email firstname.lastname@myorganization.com
Create a repo on Azure DevOps You can follow this MS documentation: https://learn.microsoft.com/en-us/azure/devops/repos/git/create-new-repo?view=azure-devops#create-a-repo-using-the-web-portal
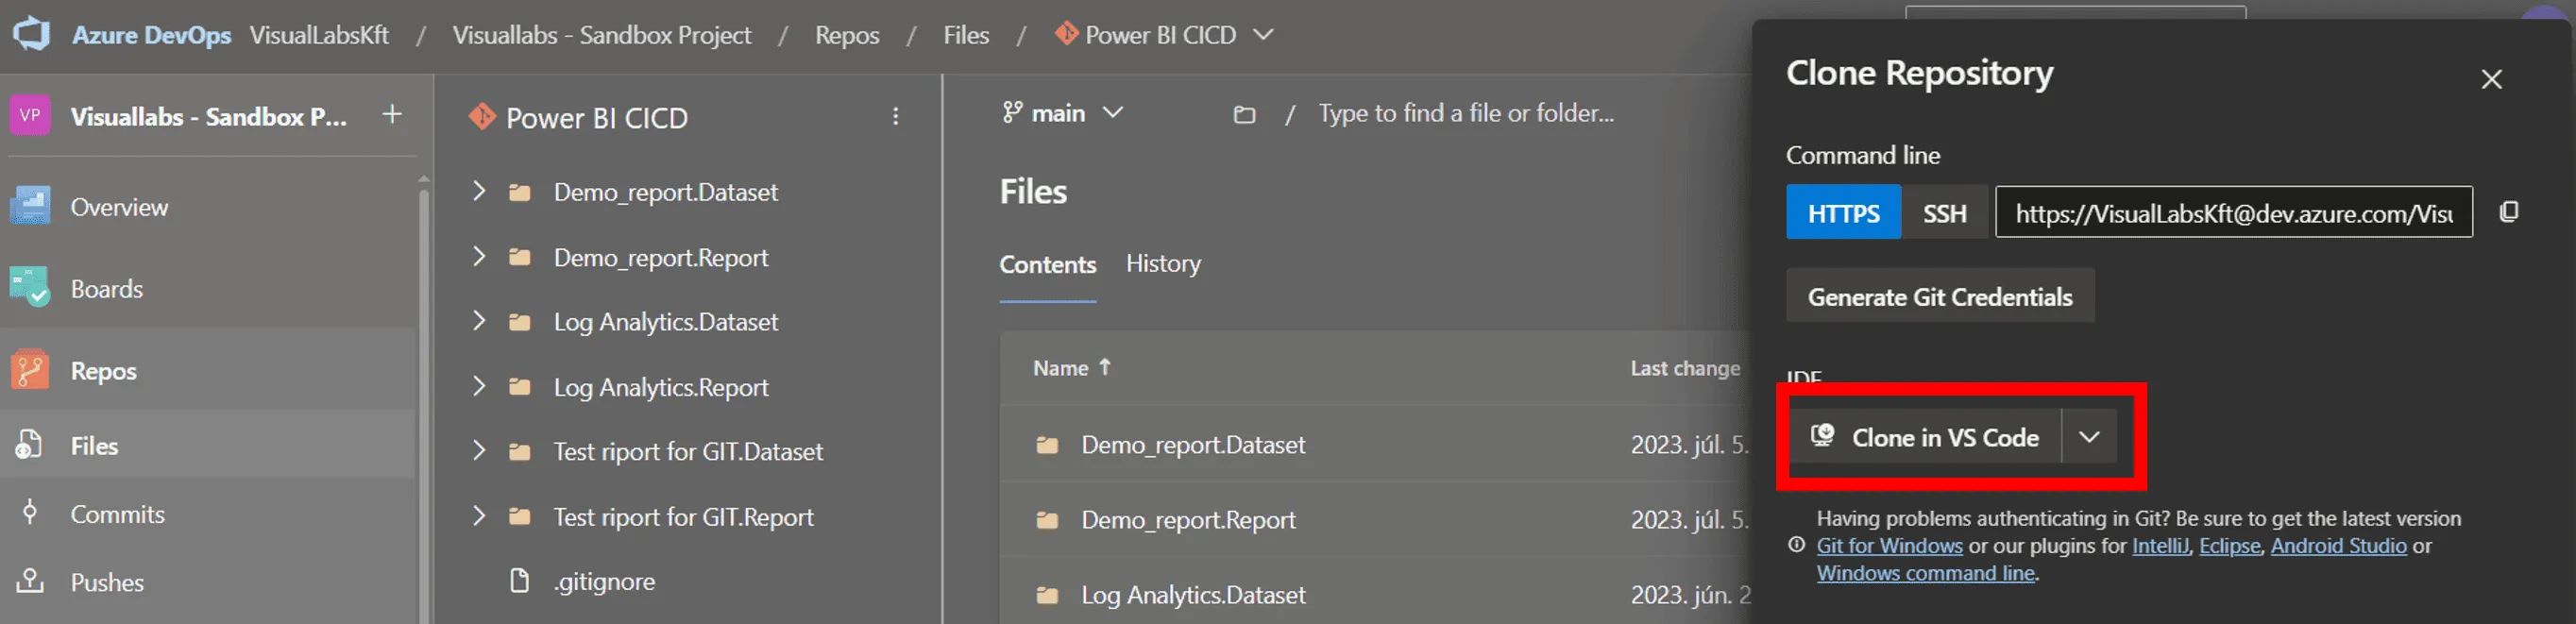
4. Once the repo is there, you’ll see this on your screen and now you can clone it onto your computer
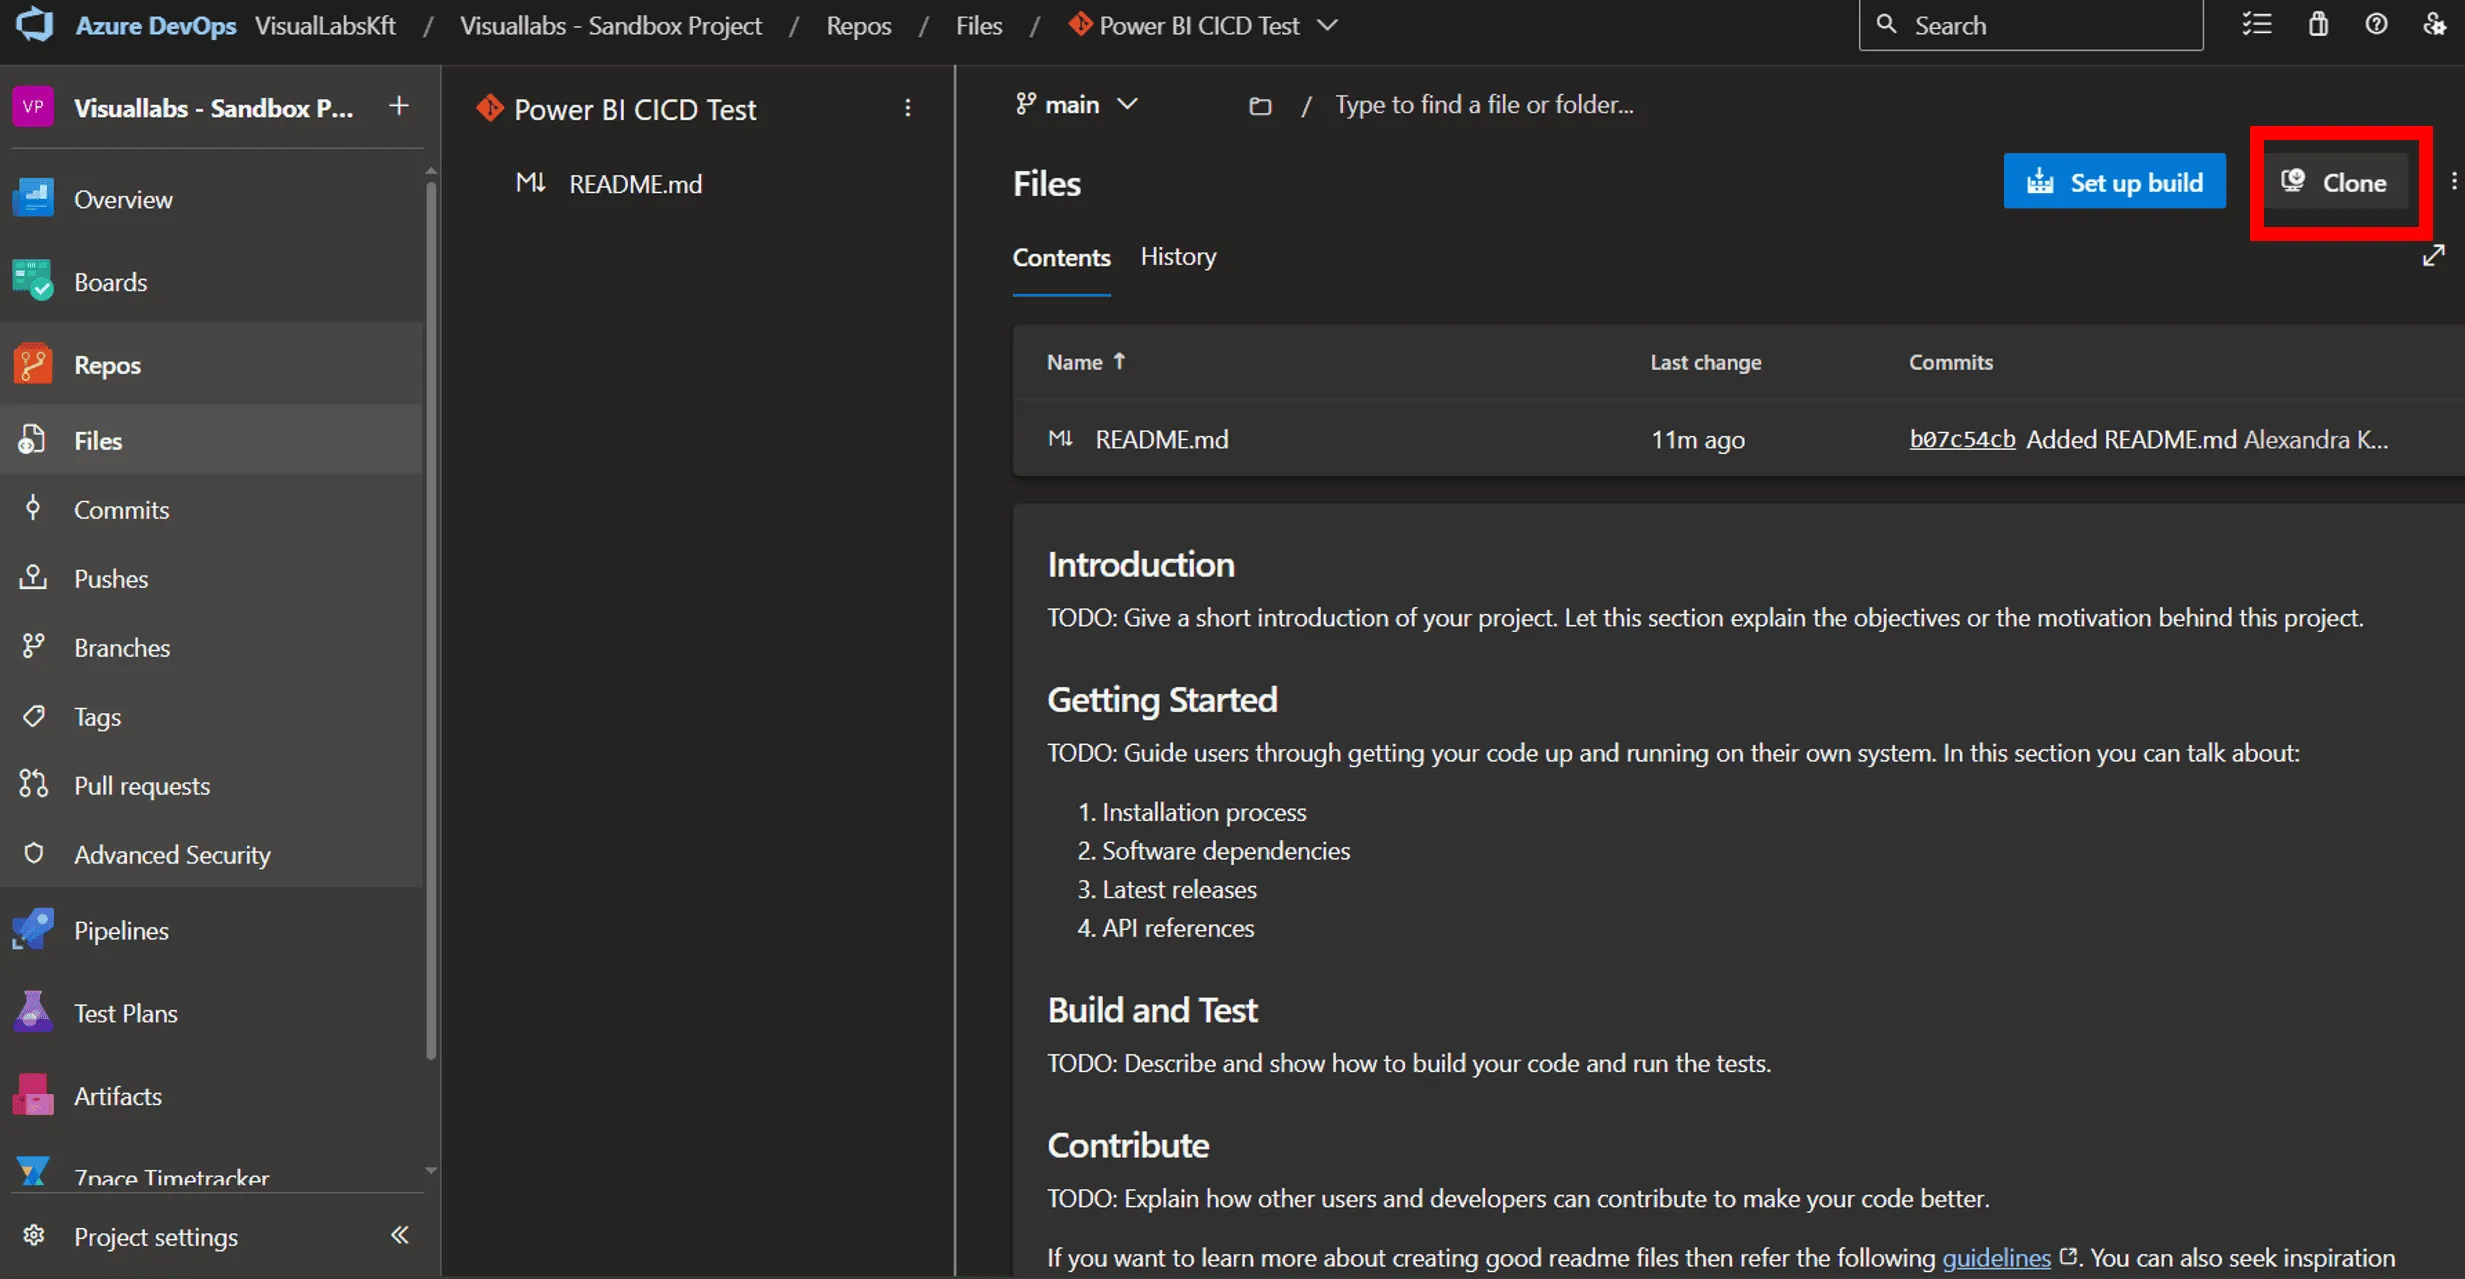
5. Select Clone in VS Code option
6. Select destination folder
My recommendation is to create a separate folder where you can store all your repos from this point. I’d also opt for a cloud location for this repo collector folder – like OneDrive.
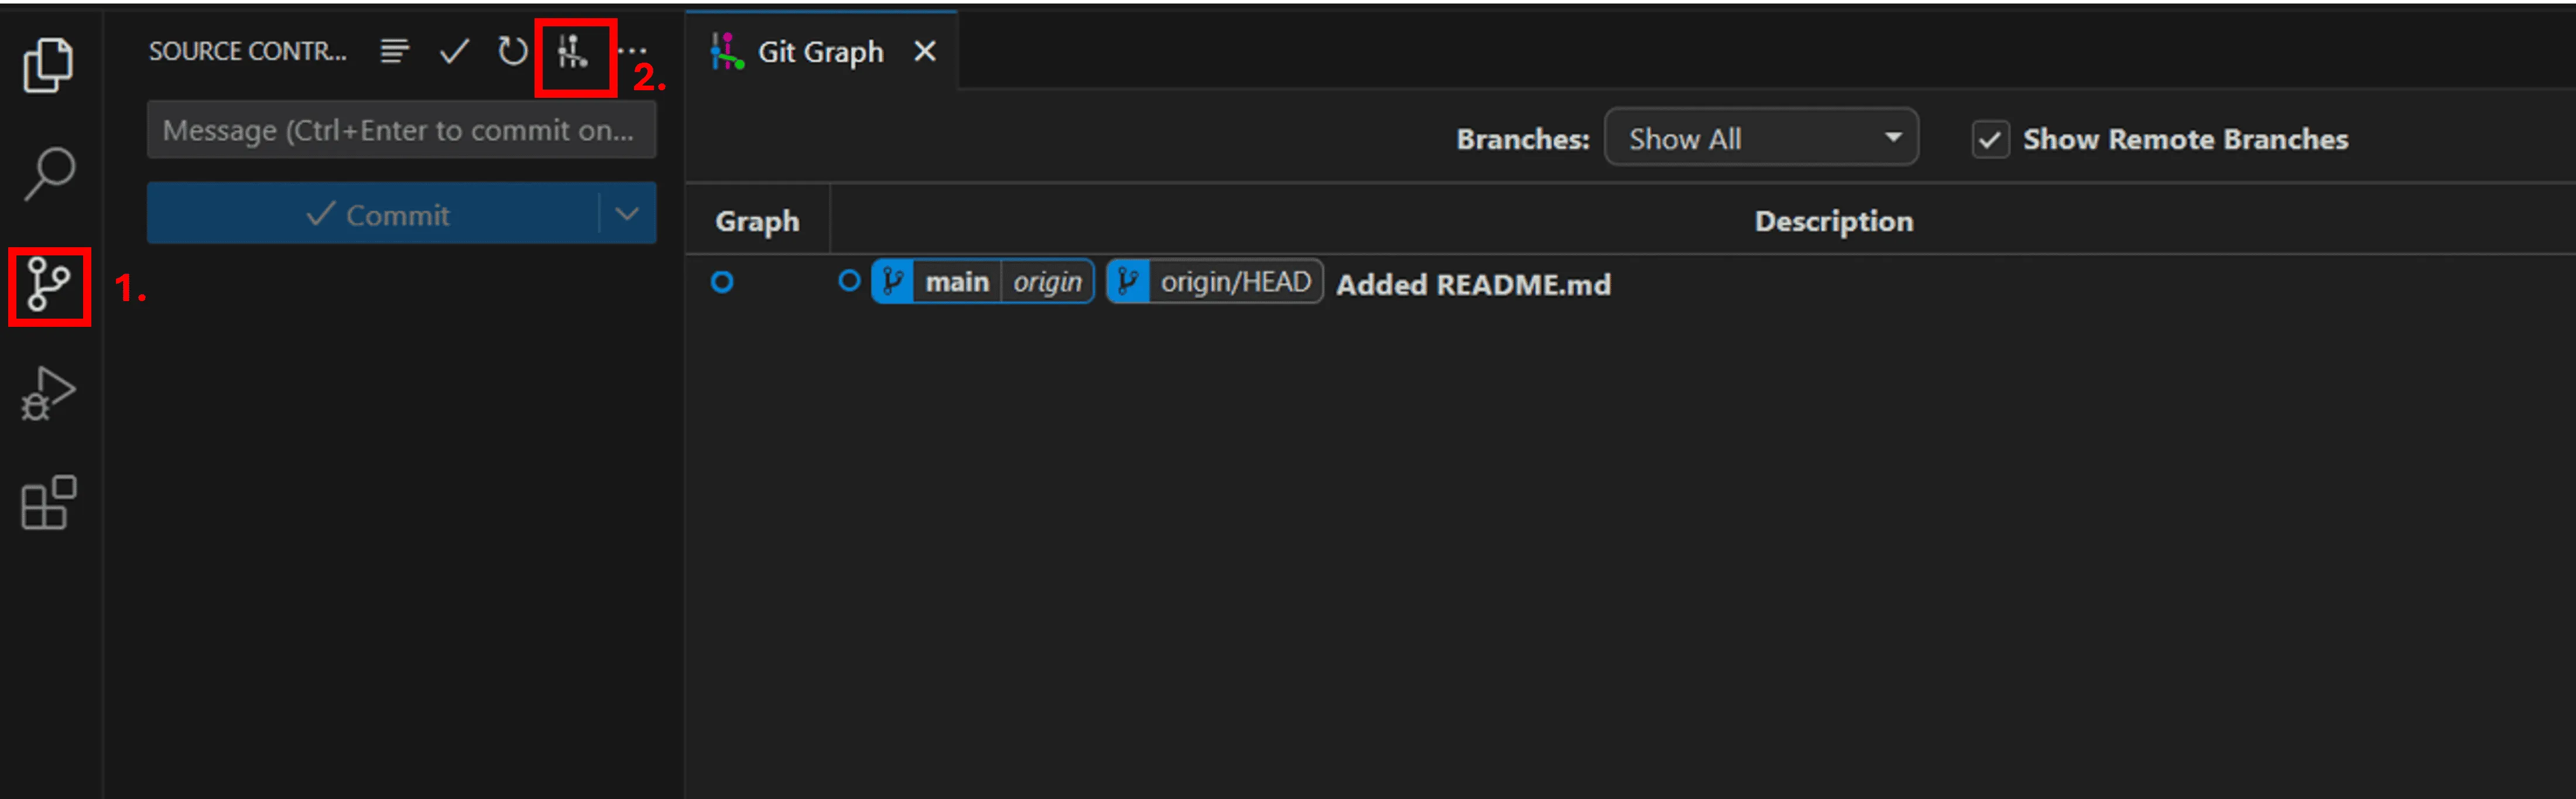
7. In VS Code, you can check the current status of your repo
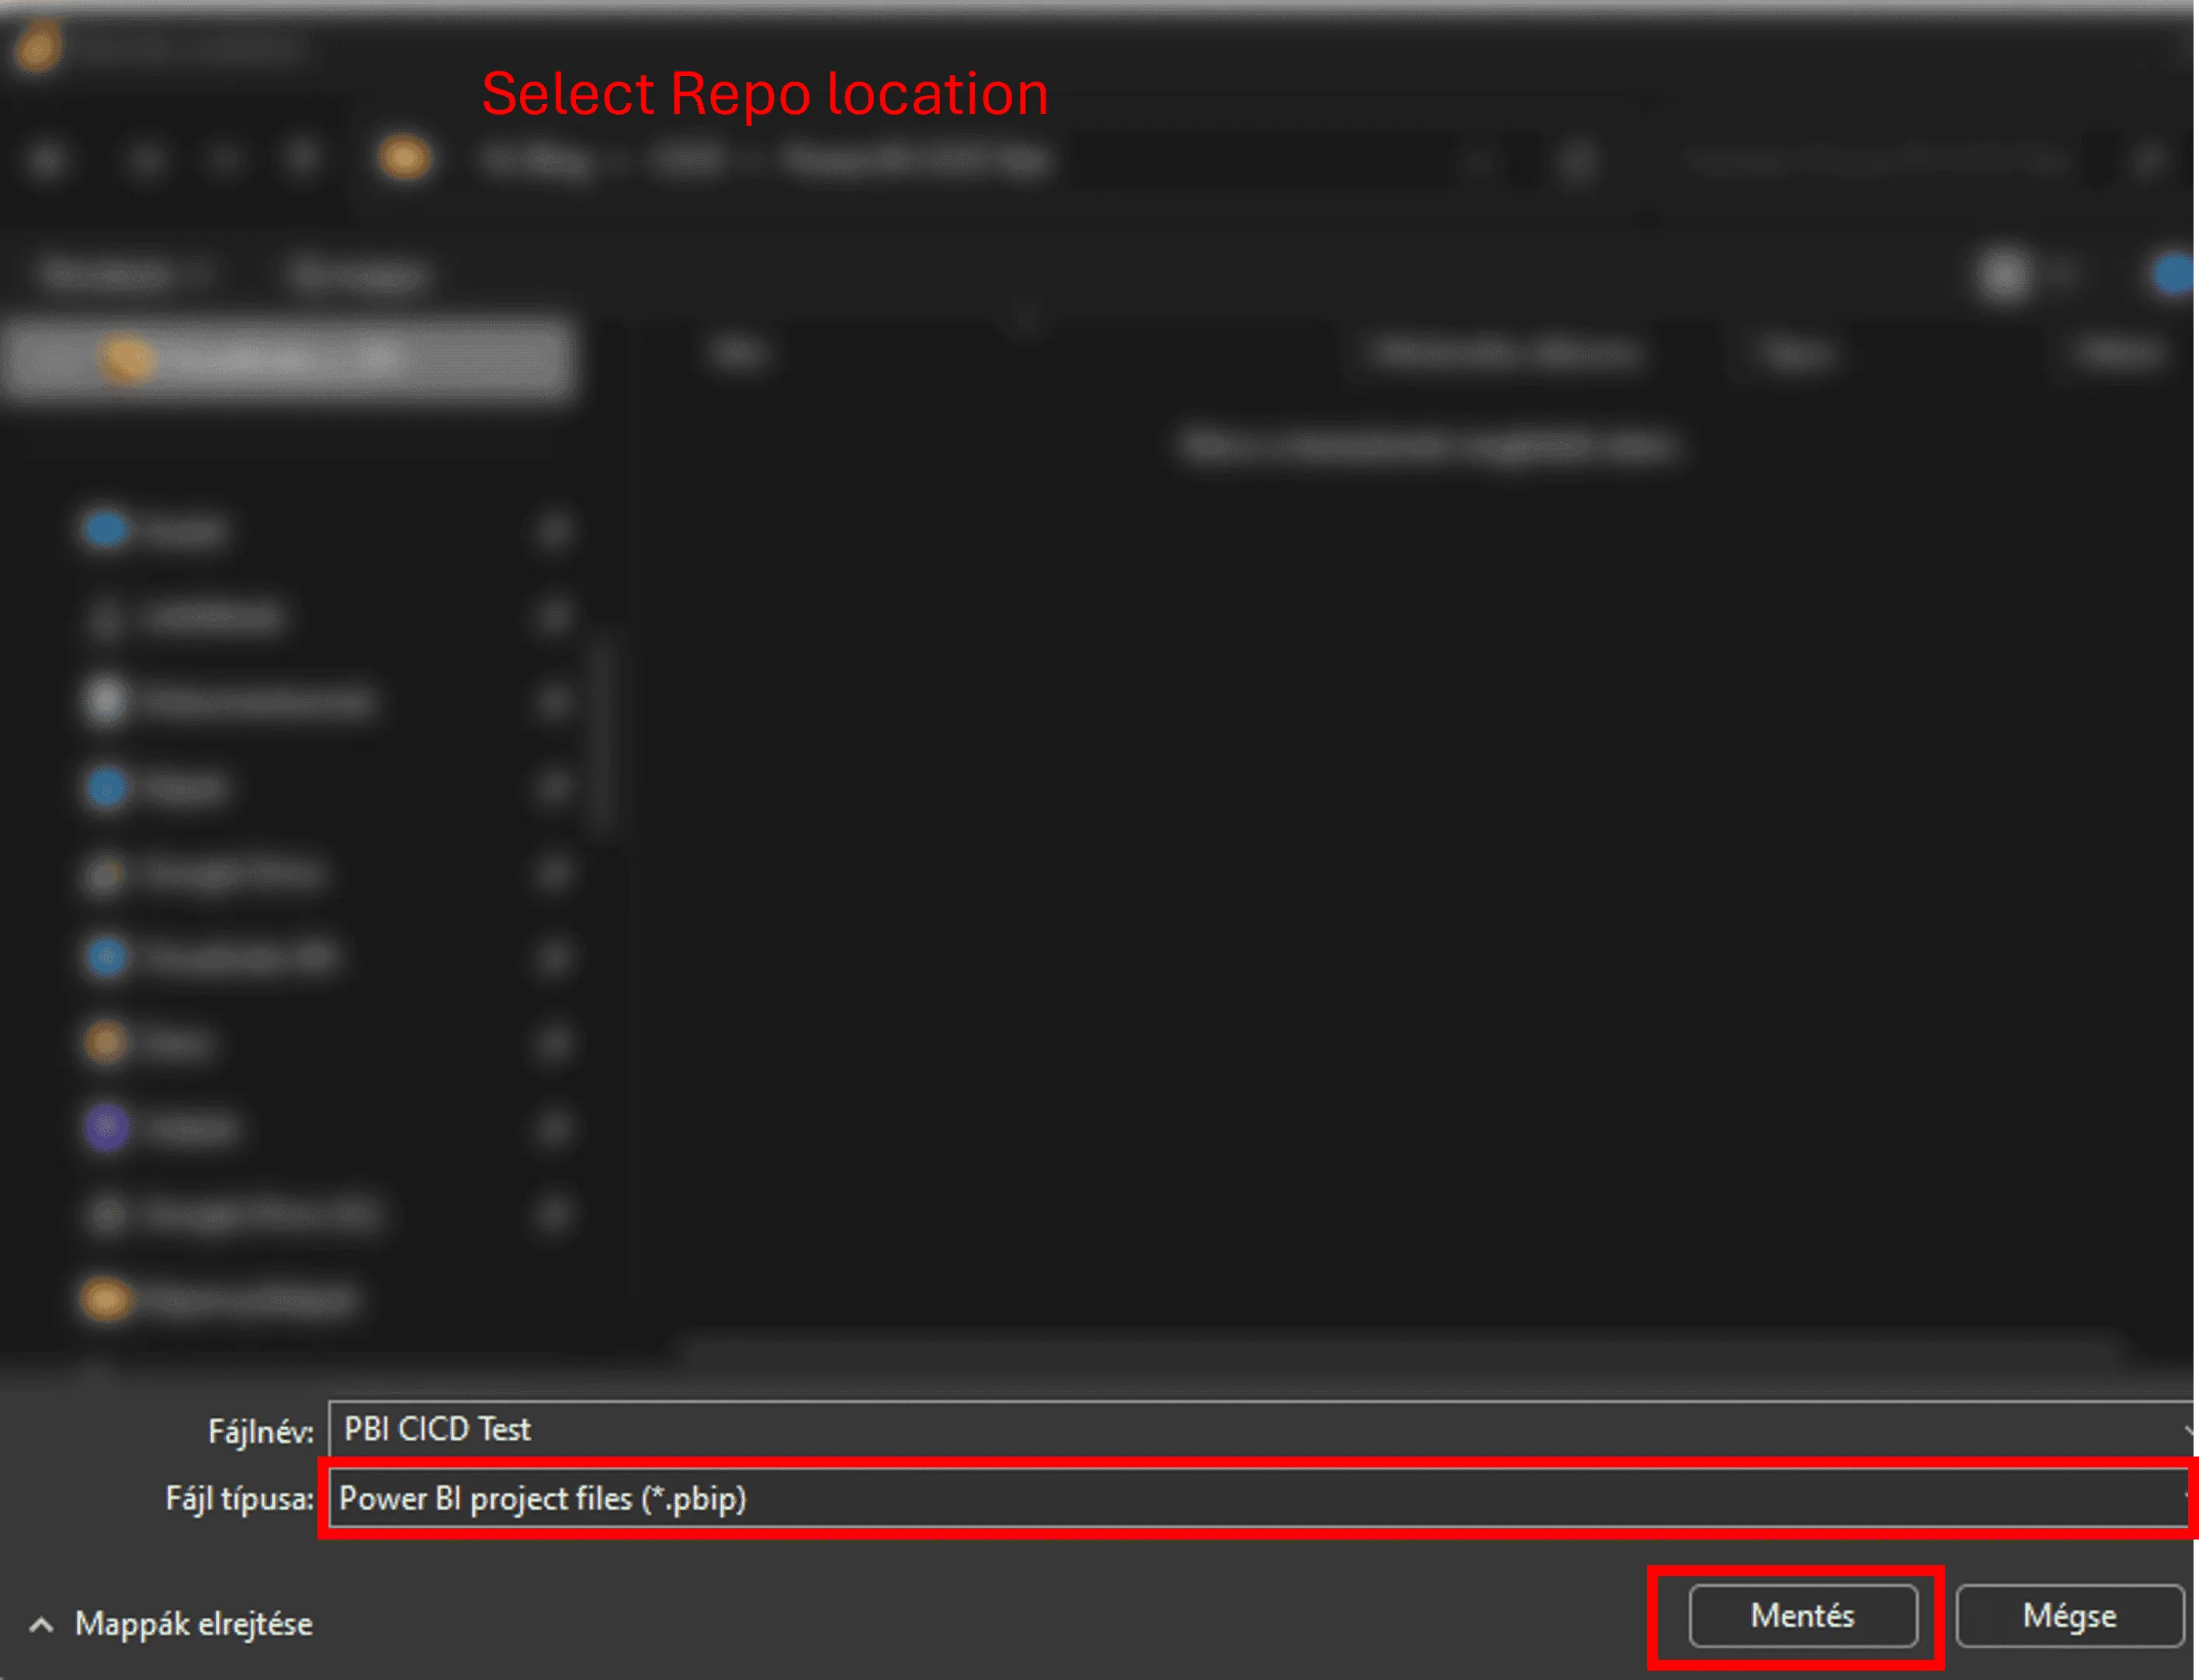
8. The last step is Save your Power BI file As.pbib to this folder.
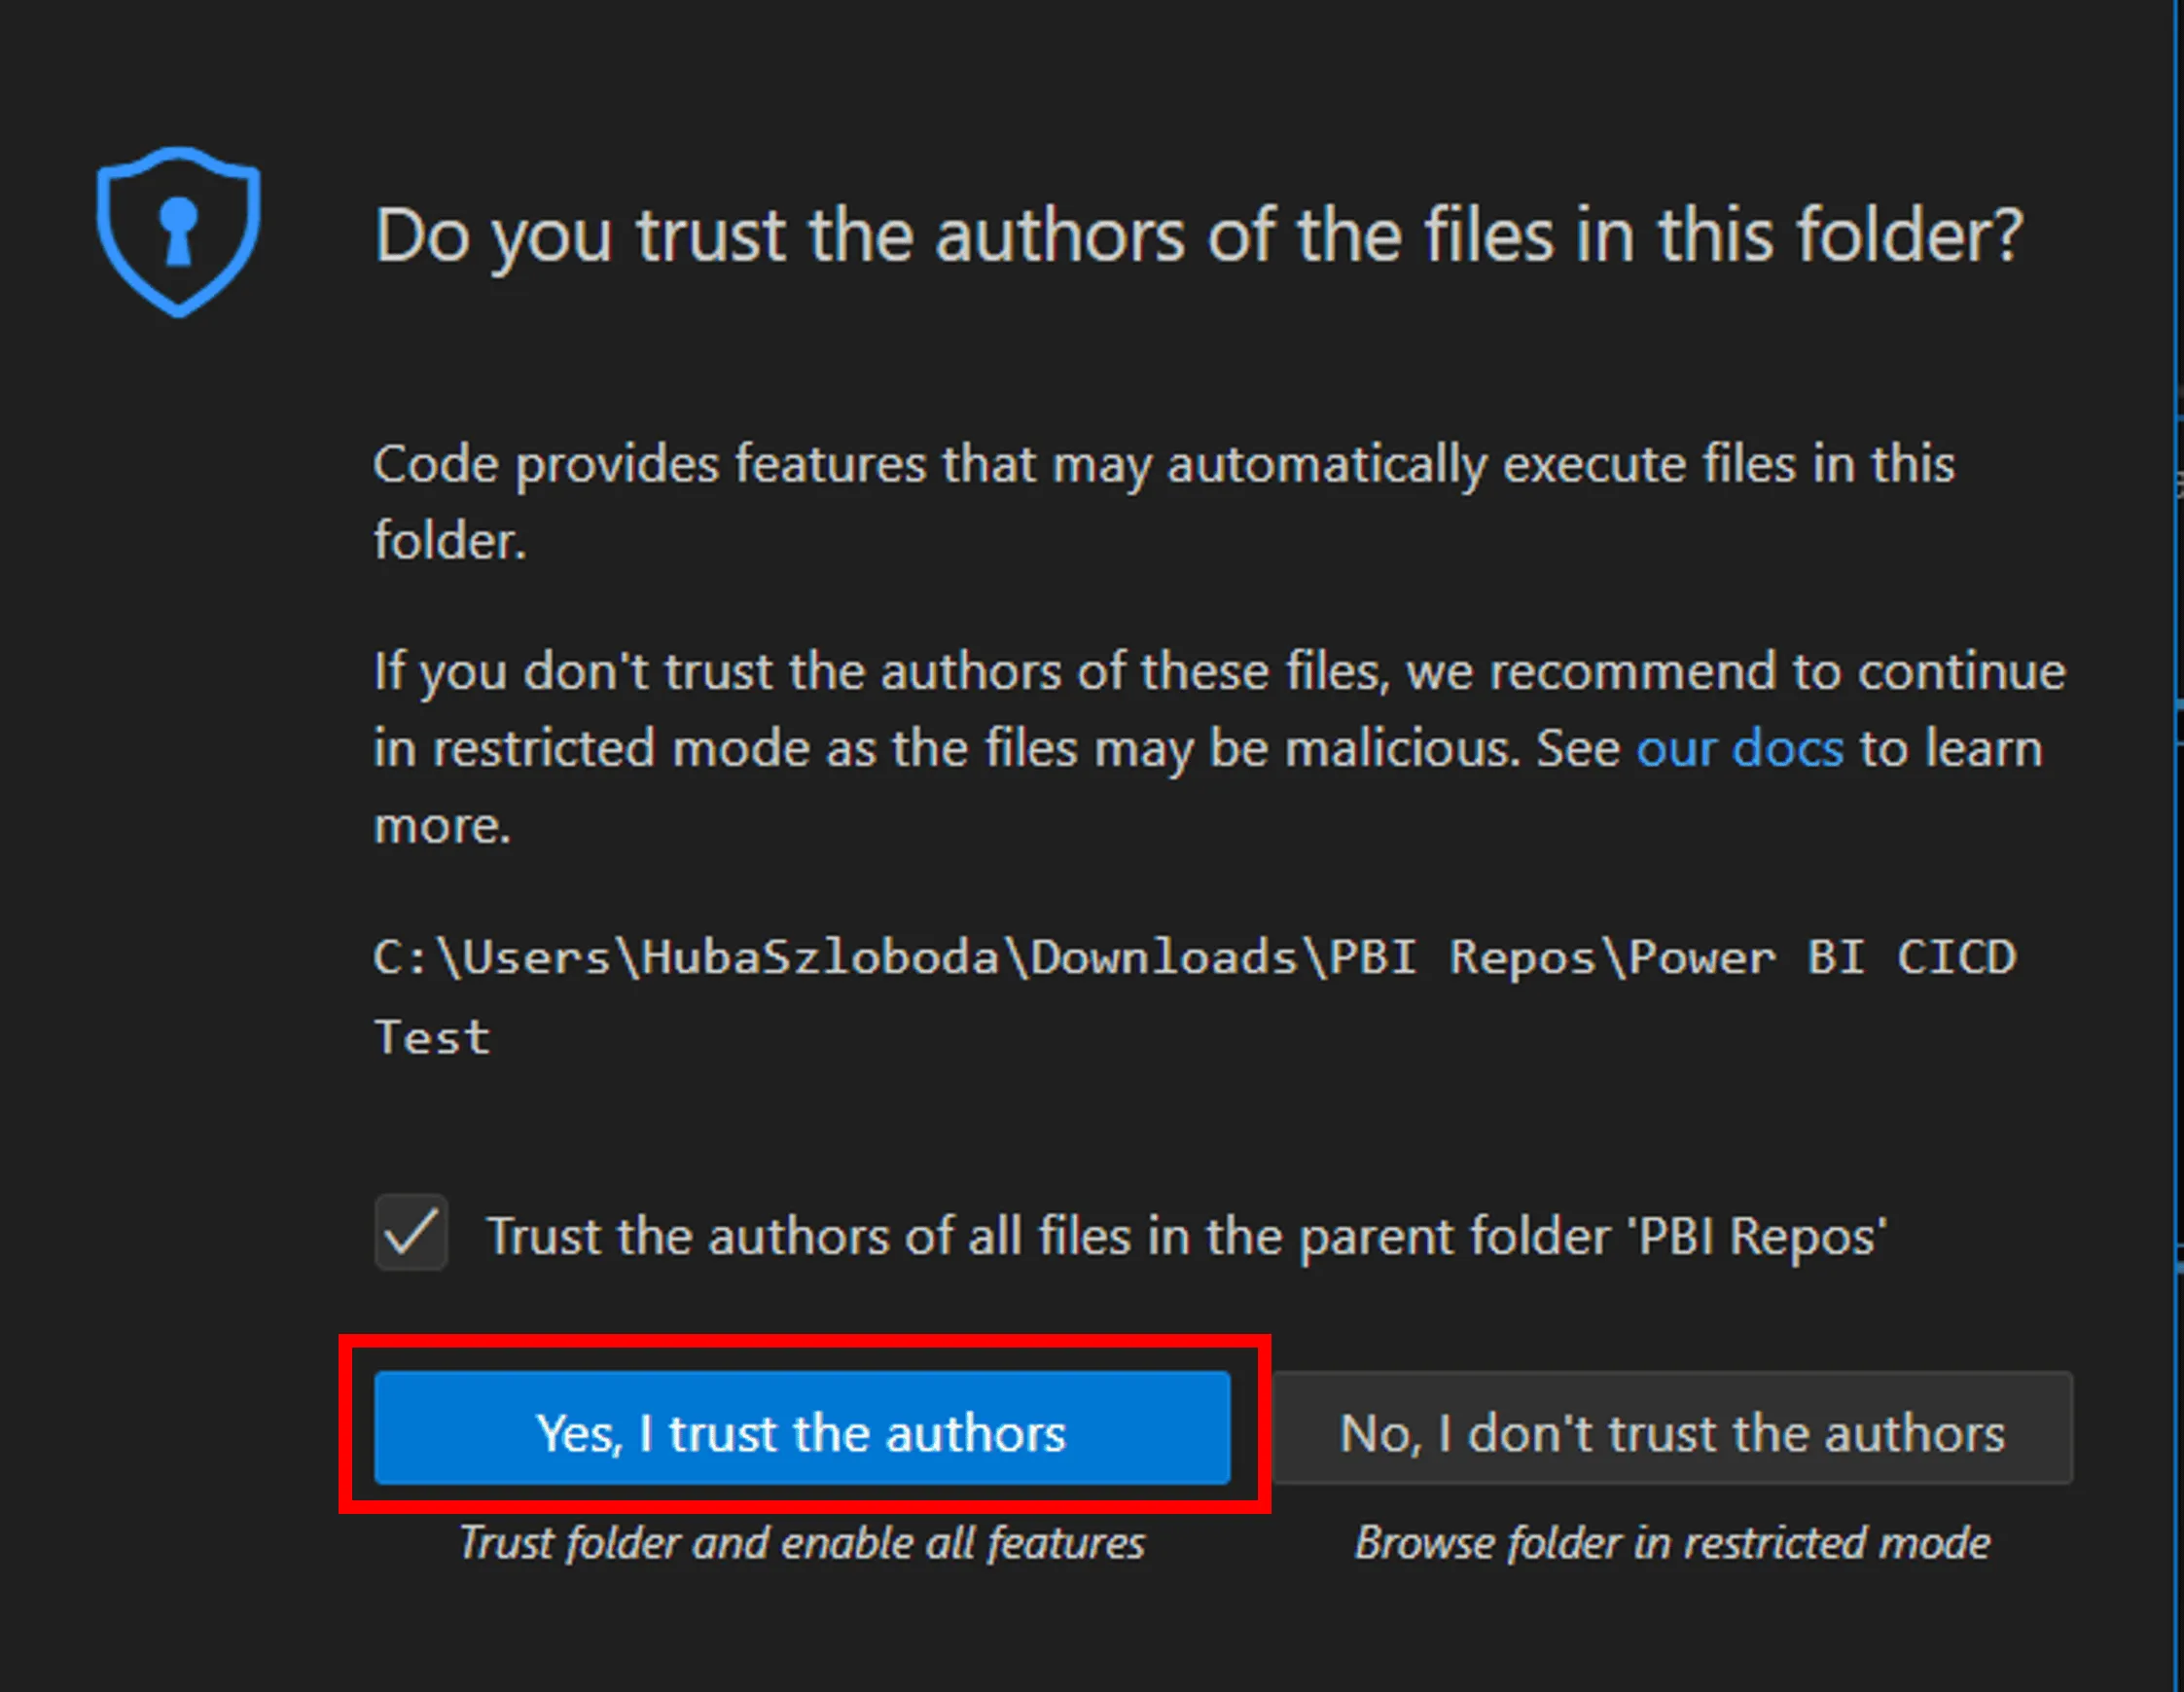
9. Click on Yes, I trust the authors to move tot he next step. You’ll see that VS Code recognized that there are new files in the folder.
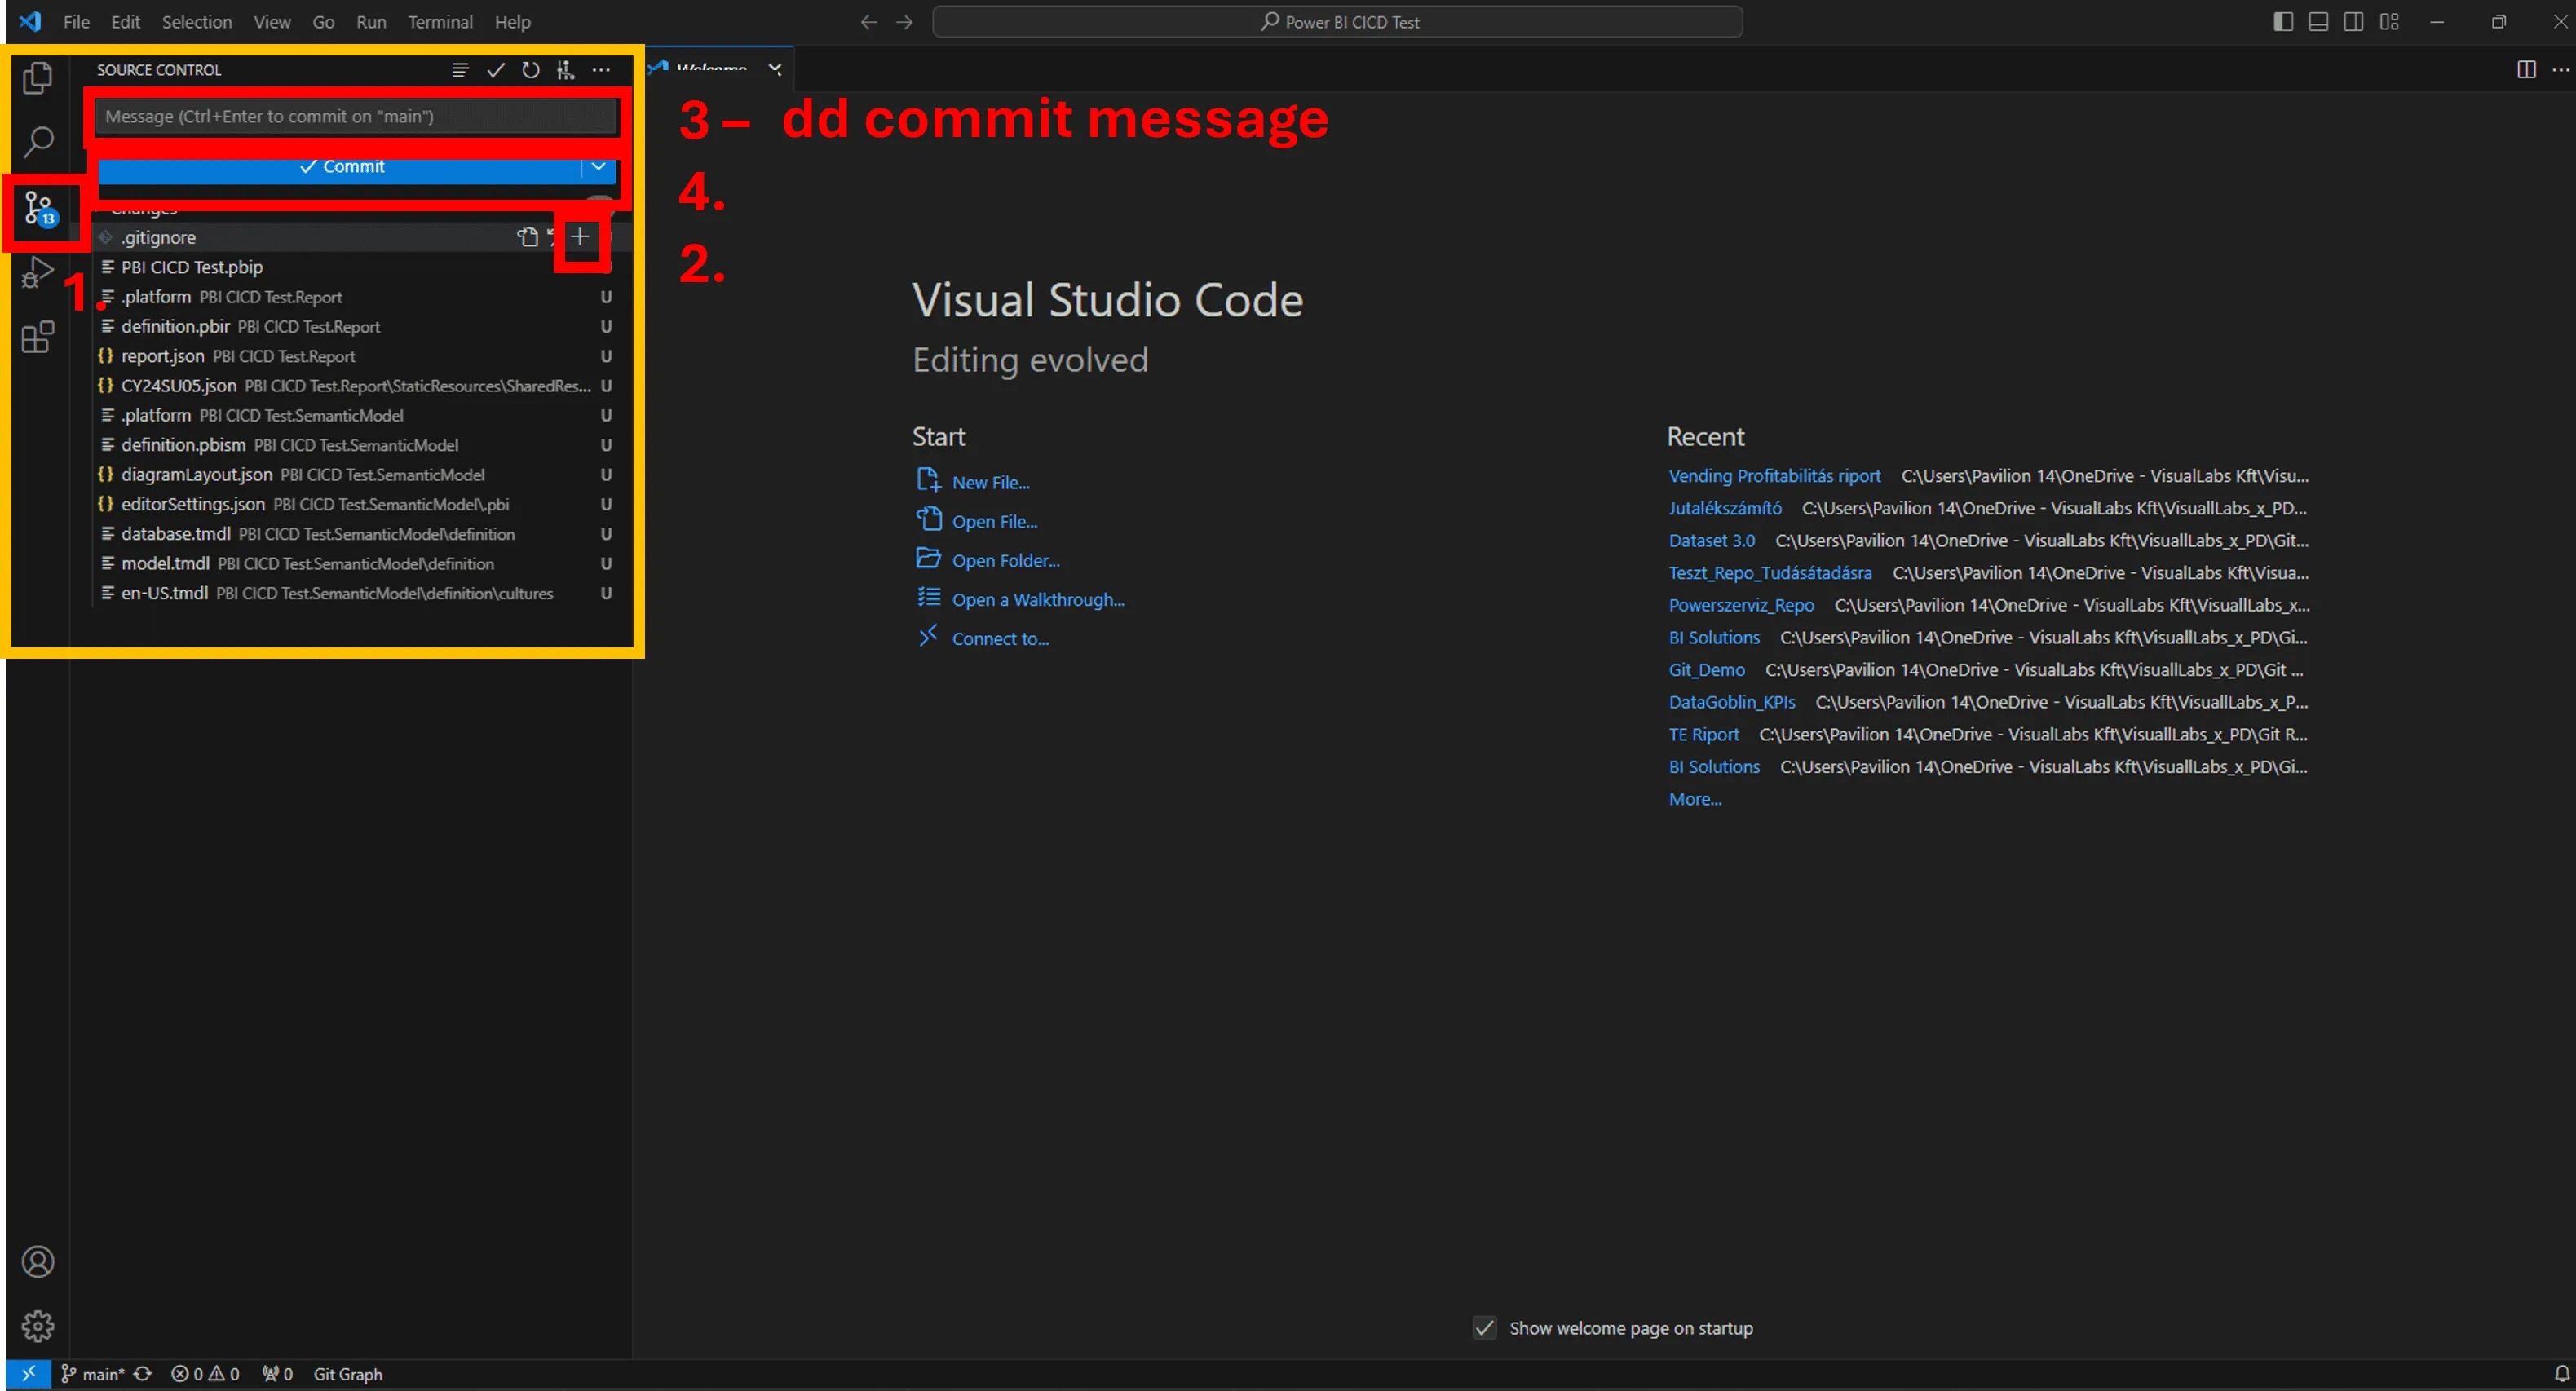
10. Now you can Add a coming message, Select the changes you want to keep (this the step called: stage changes, feel free to click on Select all) and Click Commint (it is only going to save it locally)
11. Click Sync changes (now it’s in the colud – you can check it in the Repo created on Azure DevOps)
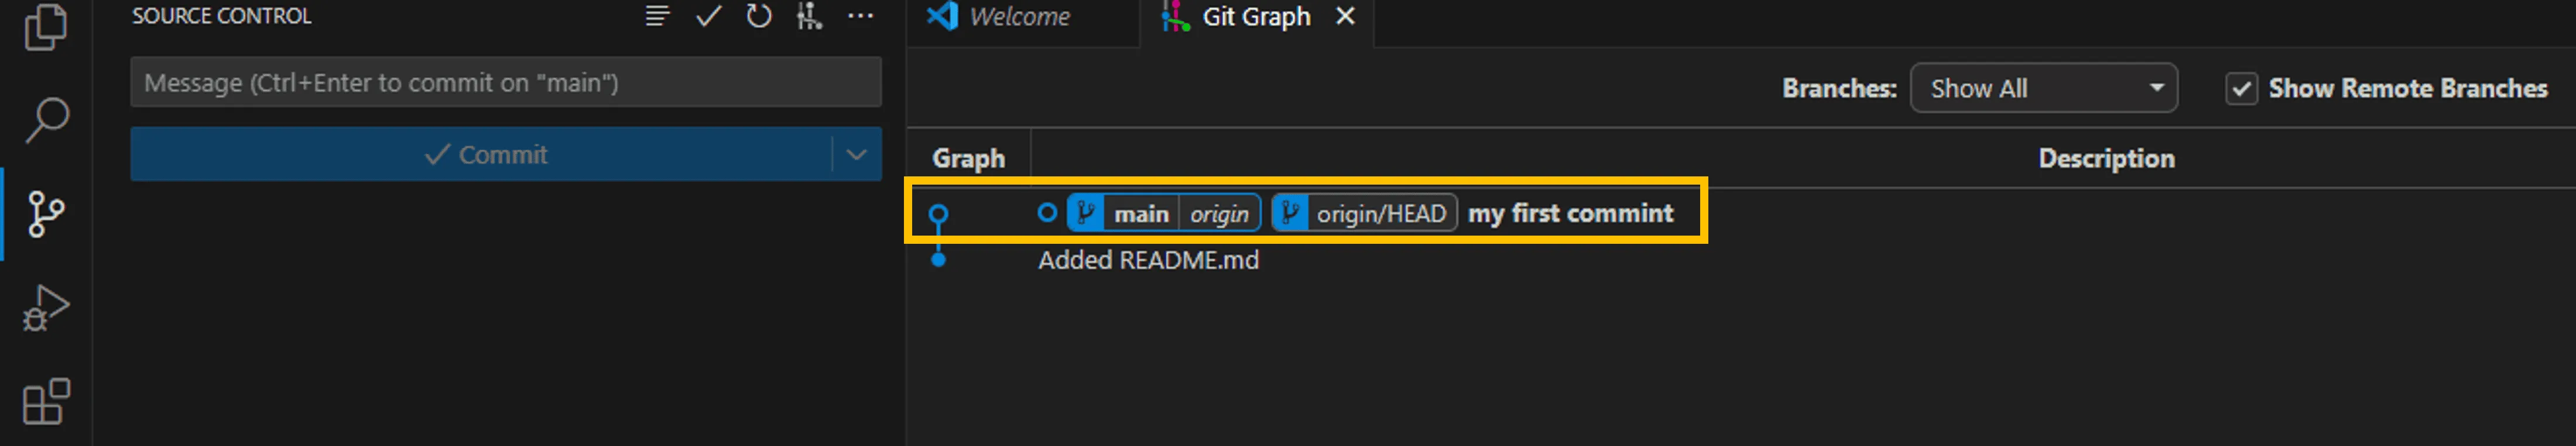
12. GitGraph will look like this:
13. Congrats!
Your source control journey has officially begun! Feel free to create branches, repos etc., and start the co-development with your colleagues or just simply enjoy that you won’t ever be named to “MyProject_final_v124_final12.pbix”

Problem Statement
Monitoring of the three platforms mentioned in the title is solved independently in different locations. Logic Apps can be monitored either from the resource’s run history page or through the Logic App Management solution deployed to a Log Analytics workspace. Azure Functions have Application Insights, while the run history of Microsoft Flows is available on the Power Platform.
Most of our clients’ solutions consist of these resources, which often chain together and call each other to represent business processes and automations. Their centralized supervision is not solved, making error tracking and analysis difficult for employees. Moreover, they had to log into the client’s environment to perform these tasks.
Goal
We wanted to get a general overview of the status of the solutions we deliver to our clients, reduce our response time, and proactively prevent error reports submitted by our clients. We aimed to track our deployments in real-time, providing a more stable system and a more convenient user experience. We wanted to make our monitoring solution available within Visuallabs so that we could carry out monitoring tasks from the tenant that hosts our daily development activities.
Solution
Infrastructure Separation
Our solution is built on the infrastructure of a client used as a test subject, whose structure can be considered a prerequisite. On the Azure side, separate subscriptions were created for each project and environment, while for Dynamics, only separate environments were used. Project-based distinction for Flows is solved based on naming conventions, and since log collection is manual, the target workspace can be freely configured.
Centralized Log Collection
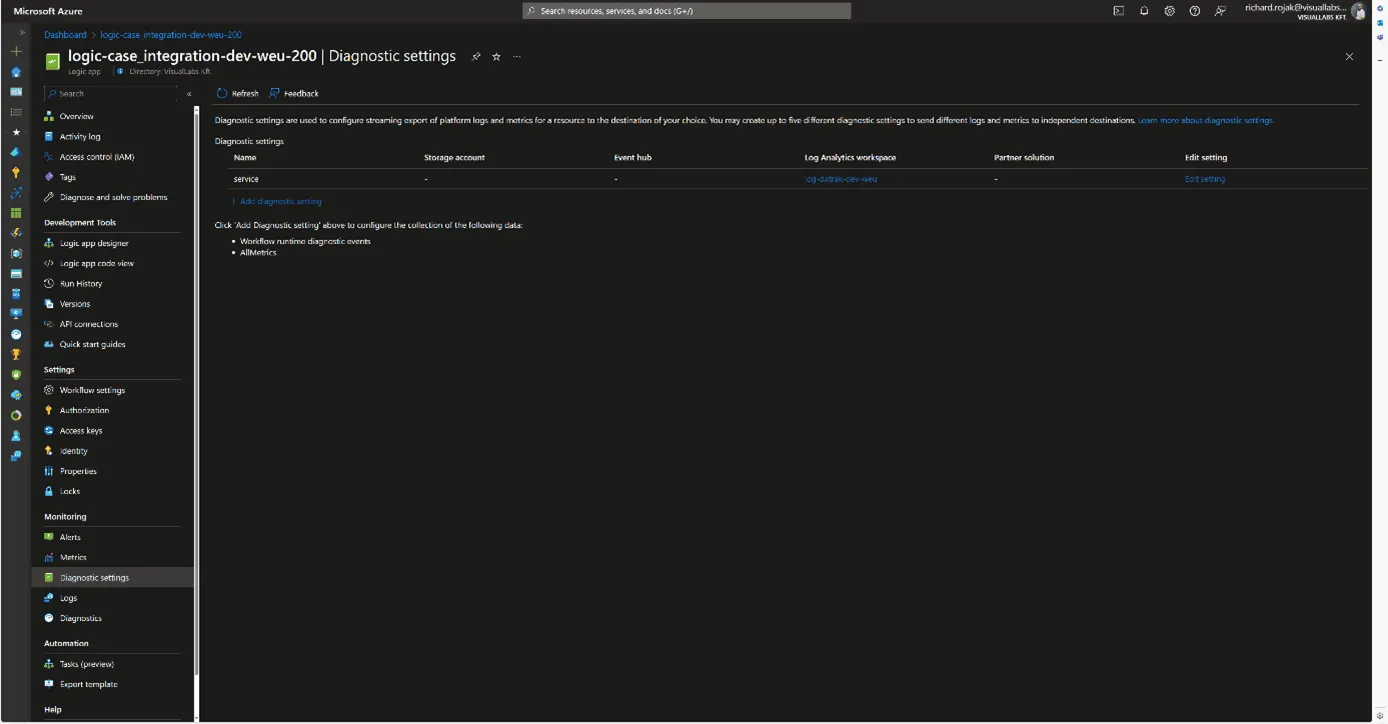
It was obvious to use Azure Monitor with Log Analytics workspaces for log collection. Diagnostic settings were configured for all Azure resources, allowing us to send logs to a Log Analytics workspace dedicated to the specific project and environment. For Microsoft Flows, we forward logs to a custom monitor table created for Flows using the built-in Azure Log Analytics Data Collector connector data-sending step. This table was created to match the built-in structure of the Logic Apps log table, facilitating the later merging of the tables.


Making Logs Accessible in Our Tenant
An important criterion for the solution was that we did not want to move the logs; they would still be stored in the client’s tenant; we only wanted to read/query them. To achieve this, we used Azure Lighthouse, which allows a role to be enforced in a delegated scope. In our case, we set up a Monitoring contributor role for the client’s Azure subscriptions for a security group created in our tenant. This way, we can list, open, and view resources and make queries on Log Analytics workspaces under the role’s scope from our tenant.
Visualization
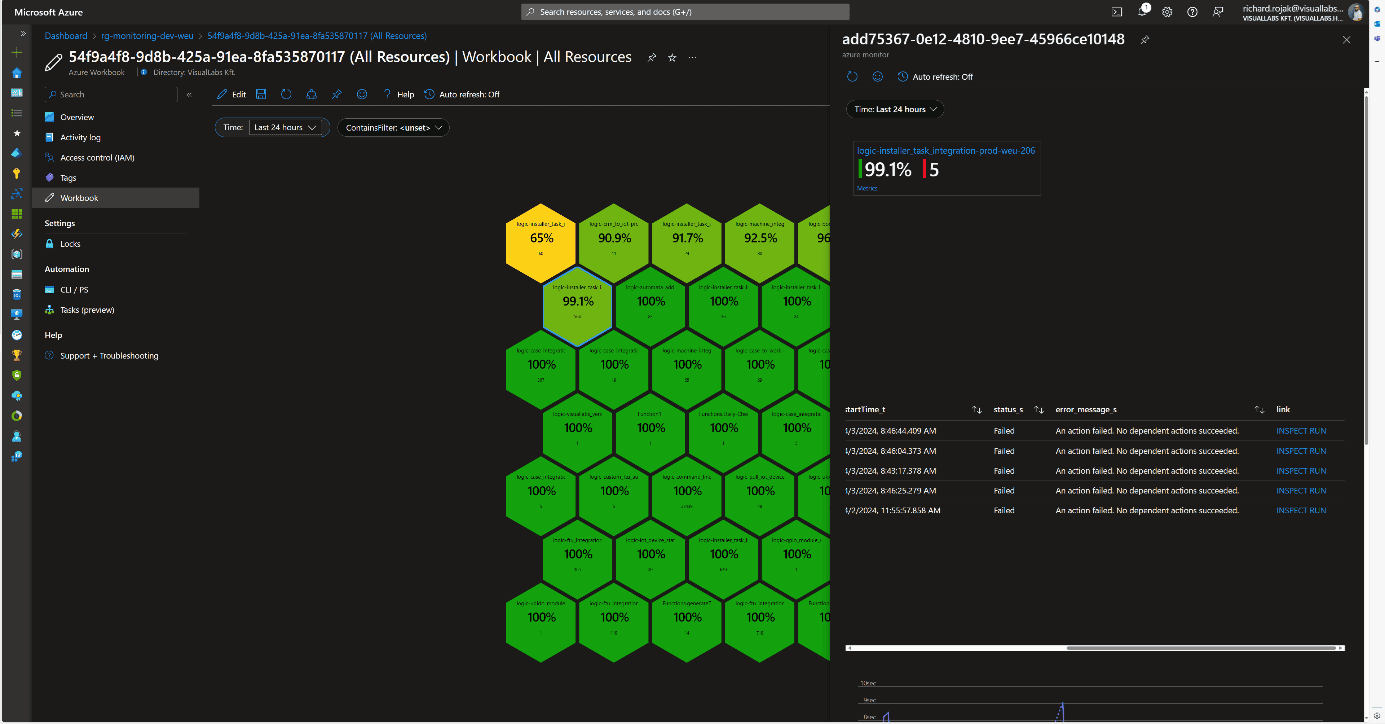
For visualization, we used Azure Monitor Workbook, which allows data analysis and visual report creation, as well as combining logs, metrics, texts, and embedding parameters. All Log Analytics workspaces we have read access to via Lighthouse can be selected as data sources. Numerous visualizations are available for data representation; we primarily used graphs, specifically honeycomb charts, but these can easily be converted into tables or diagrams.

Combining, Customizing, and Filtering Tables
To process log tables from different resources together, we defined the columns that would be globally interpretable for all resource types and necessary for grouping and filtering.
These include:
- Client/Tenant ID
- Environment/Subscription ID
- Resource ID/Resource Name
- Total number of runs
- Number of successful runs
- Number of failed runs
Based on these, we could later determine the client, environment, project, resource, and its numerical success rate, as well as the URLs needed for references. These formed the basis for combining tables from various Log Analytics Workspaces and resources for our visualizations.

User Interface and Navigation
When designing the user interface, we focused on functionality and design. Our goal was to create a visually clear, well-interpreted, interactive solution suitable for error tracking. Workbooks allow embedding links and parameterizing queries, enabling interactivity and interoperability between different Workbooks. Utilizing this, we defined the following levels/types of pages:
- Client
- Project
- Resources
- Logic App
- Azure Function
- Flow

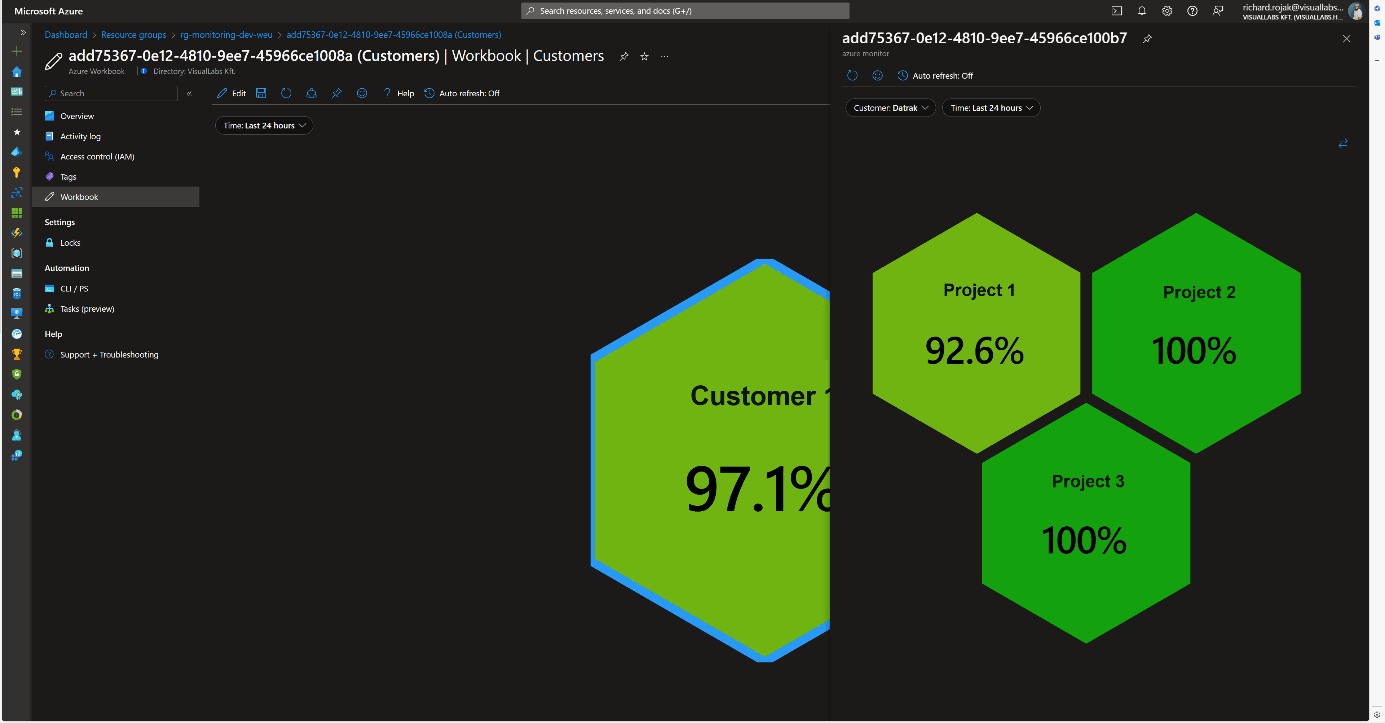

At the Client and Project levels, clicking on their names displays the next subordinate Workbook in either docked or full-window view, passing the appropriate filtering parameters. Time is passed as a global parameter during page navigation, but it can be modified and passed deeply on individual pages. We can filter runs retrospectively by a specific minute, hour, day, or even between two dates.
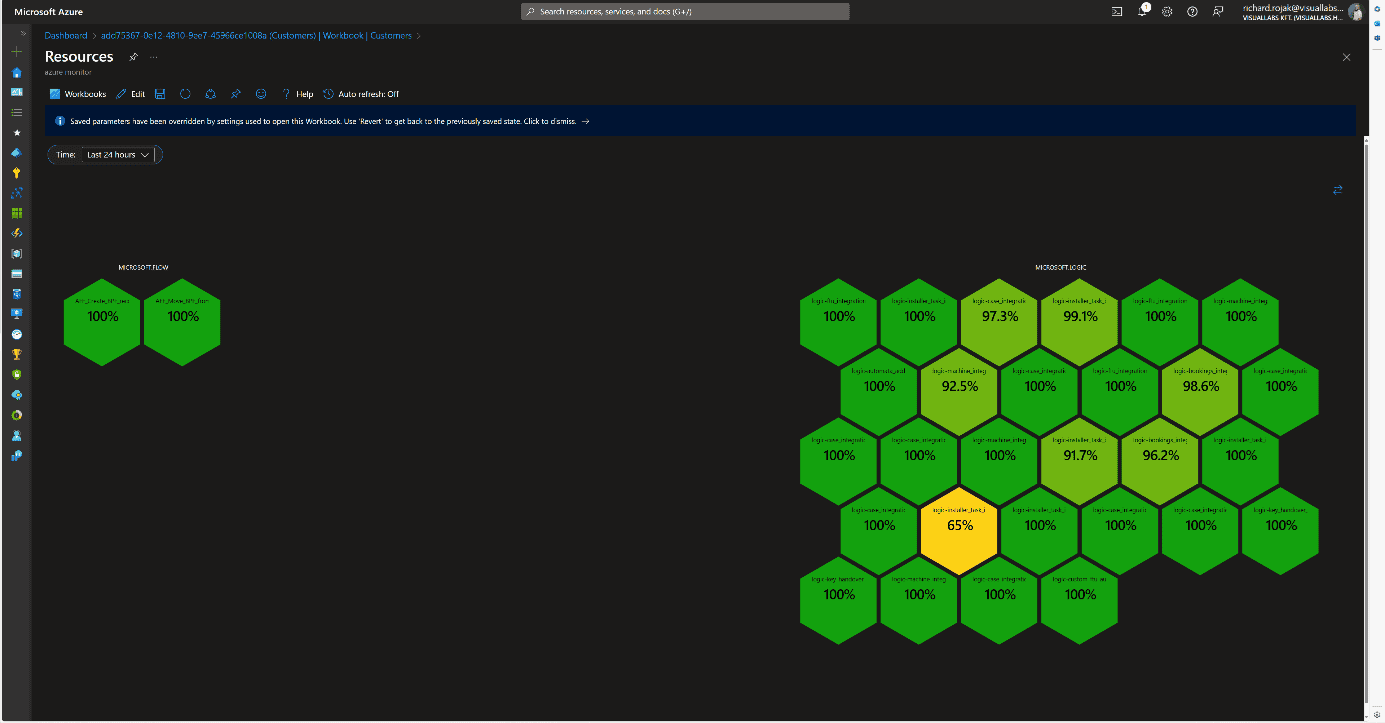
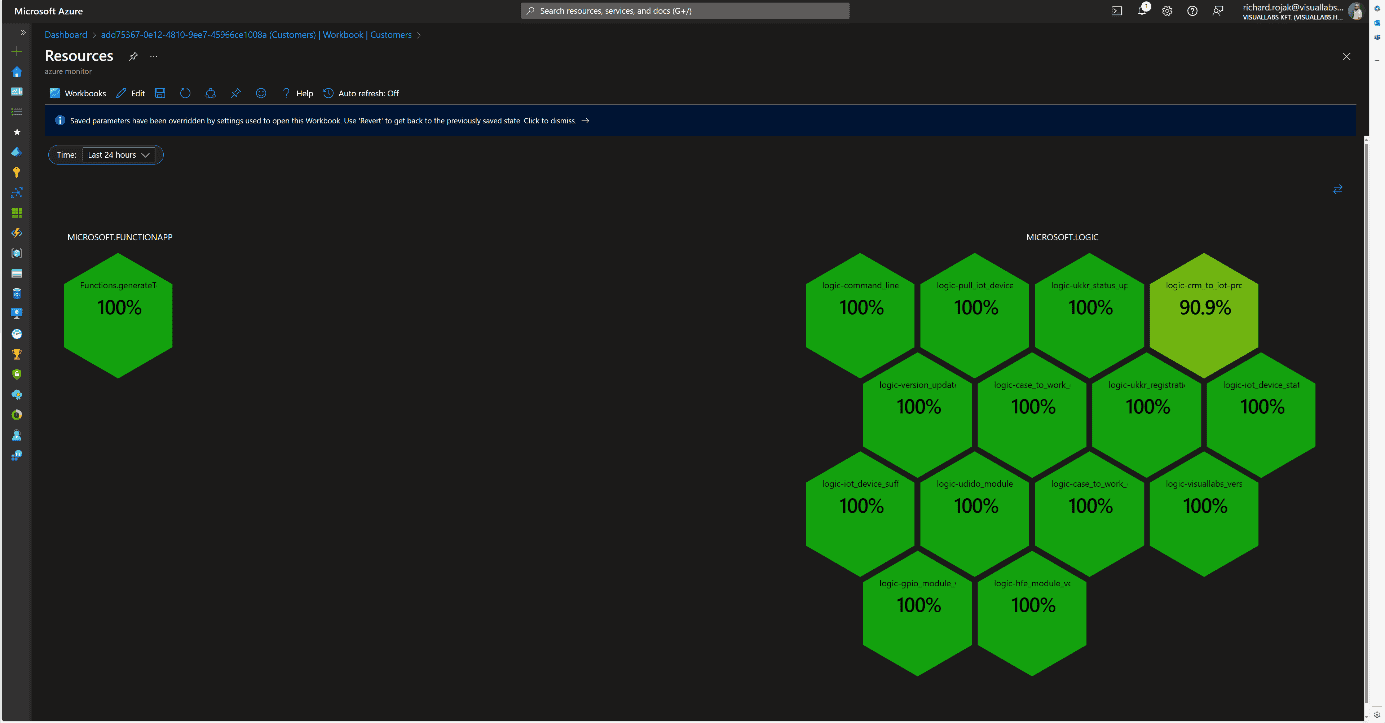
On the page displaying resources, we provide multiple interactions for users. Clicking on resource names navigates to the resource’s summary page on the Azure Portal within the tenant, thanks to Lighthouse, without tenant switching (except for Power Automate Flows).
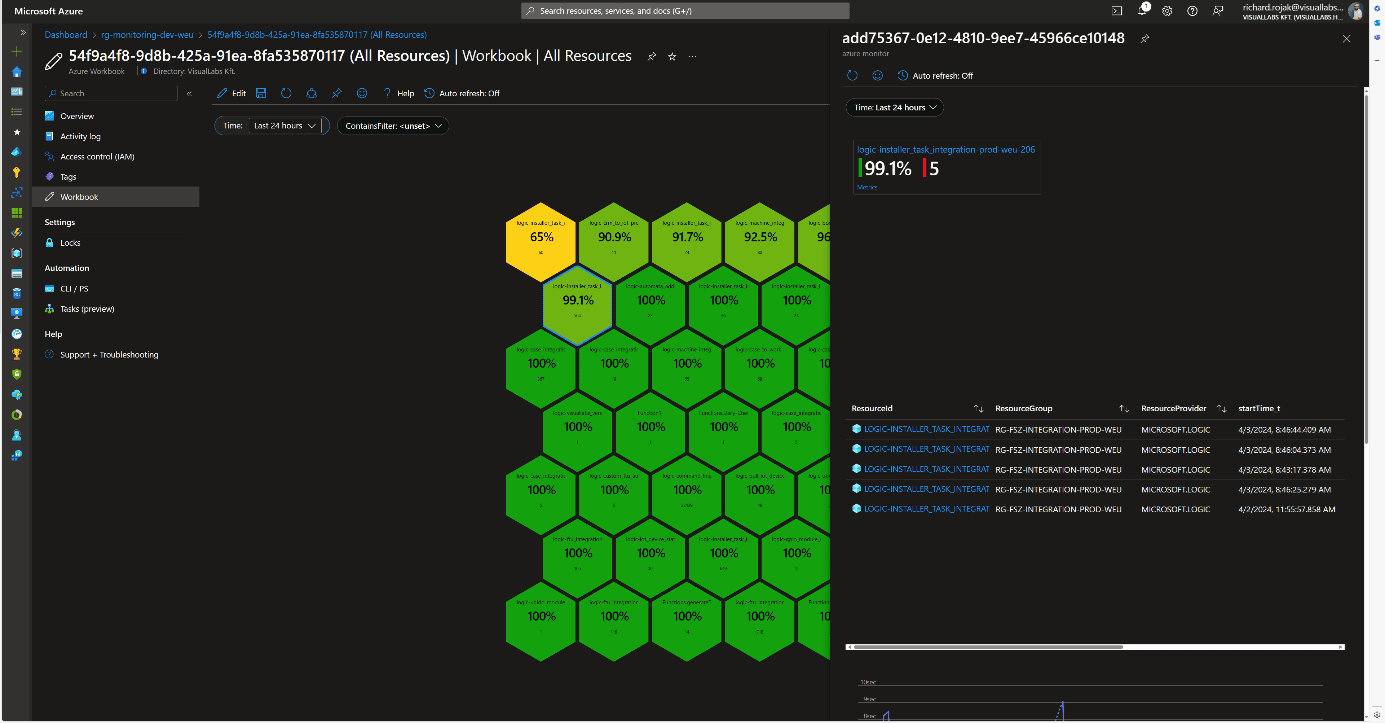
Clicking on the percentage value provides a deeper insight into the resource’s run history and errors in docked view. This detailed view is resource type-specific, meaning each of the three resources we segregated has its own Workbook. We always display what percentage of all runs were successful and how many faulty runs occurred, with details of these runs.
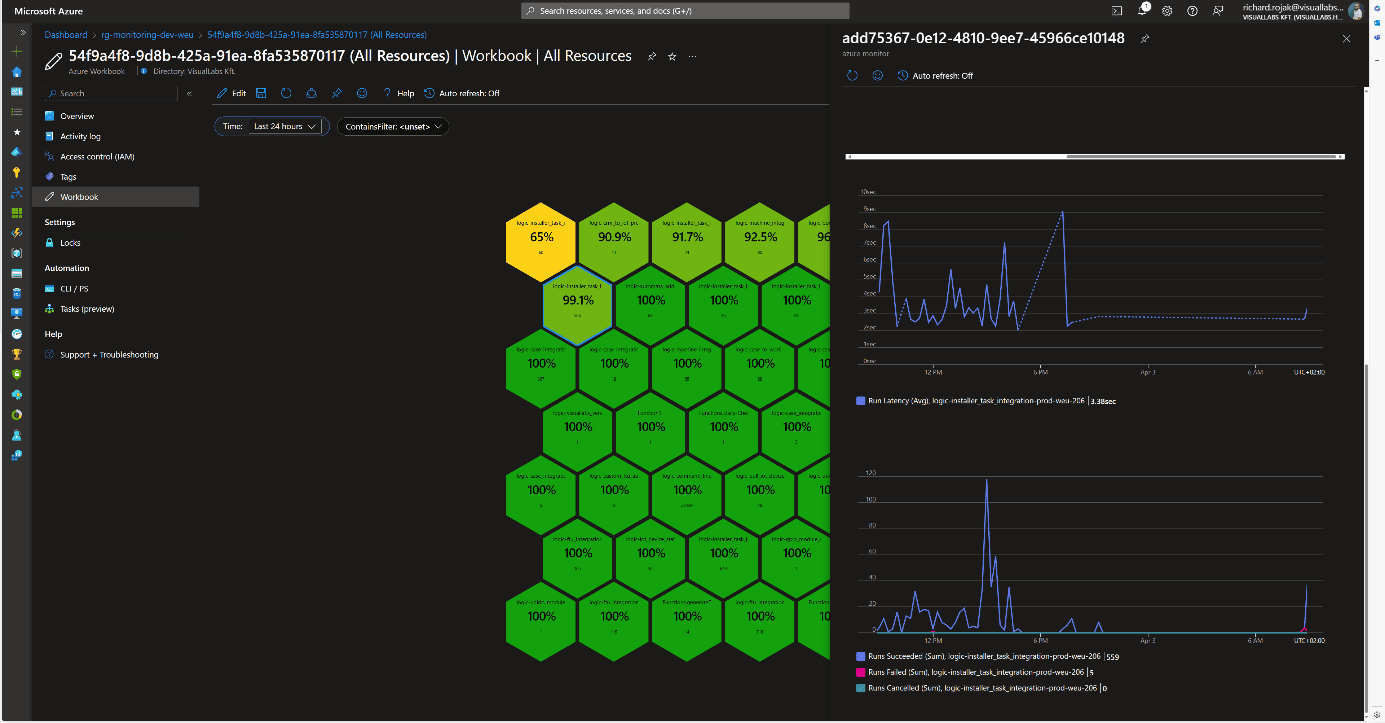
Logic App
Beyond general information, faulty runs (status, error cause, run time) are displayed in tabular form if any occurred during the specified time interval. Clicking the INSPECT RUN link redirects the user to the specific run where all successful and failed steps in the process can be viewed. At the bottom, the average run time and the distribution of runs are displayed in diagram form.
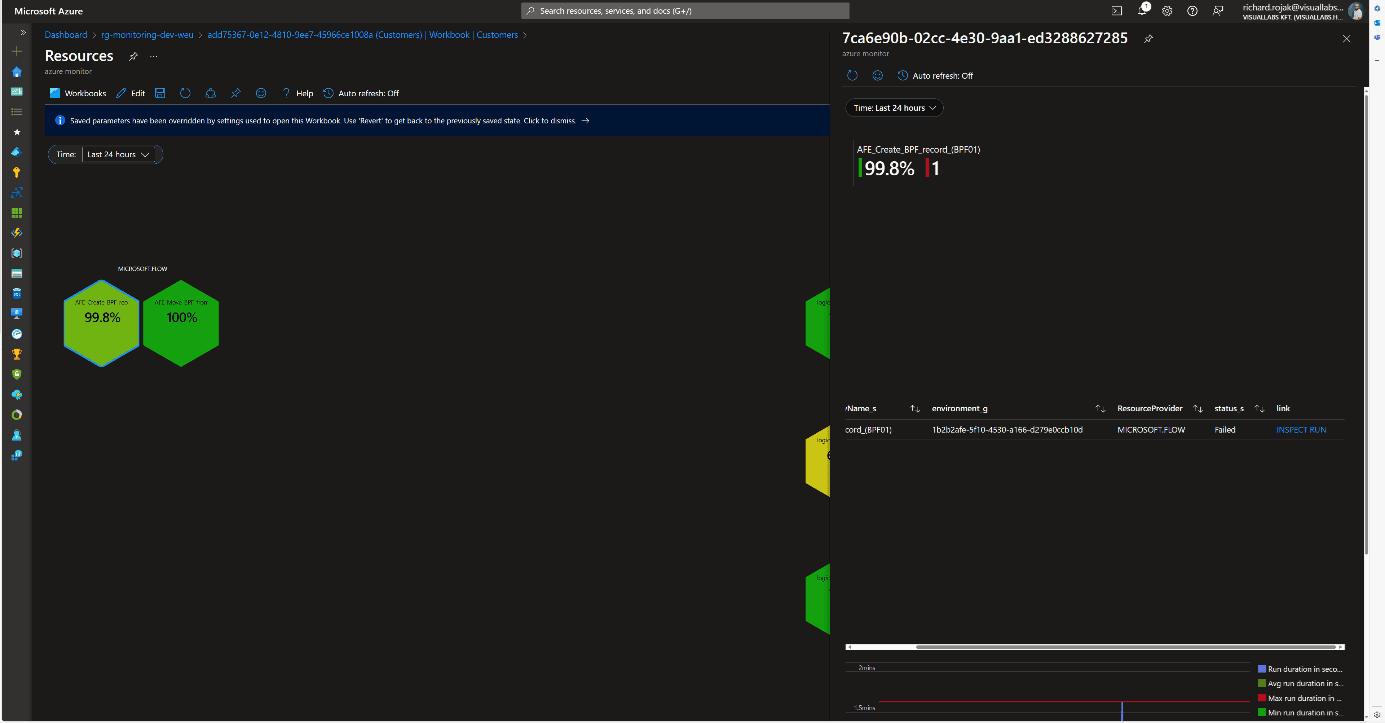
Microsoft Flow
For Flows, the same information as for Logic Apps is displayed. The link also redirects to the specific run, but since it involves leaving Azure, logging in again is required because Dynamics falls outside the scope of Lighthouse.
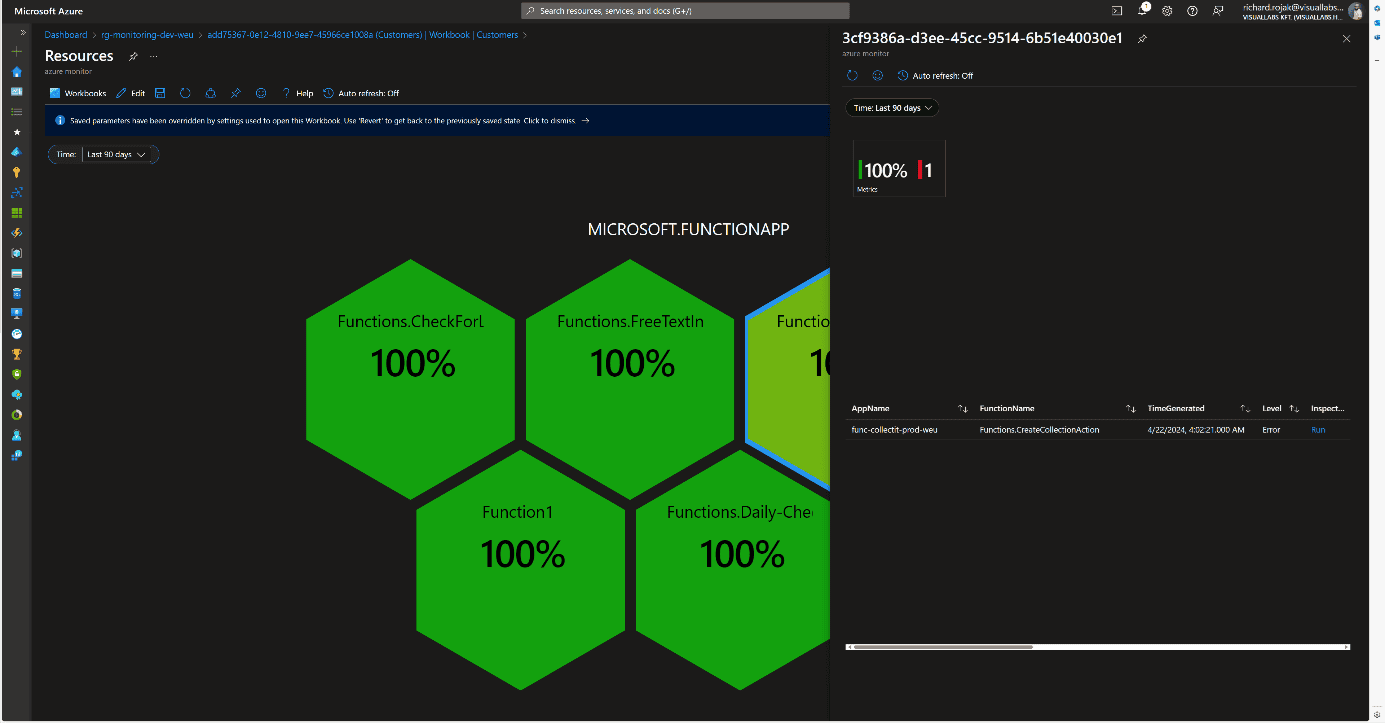
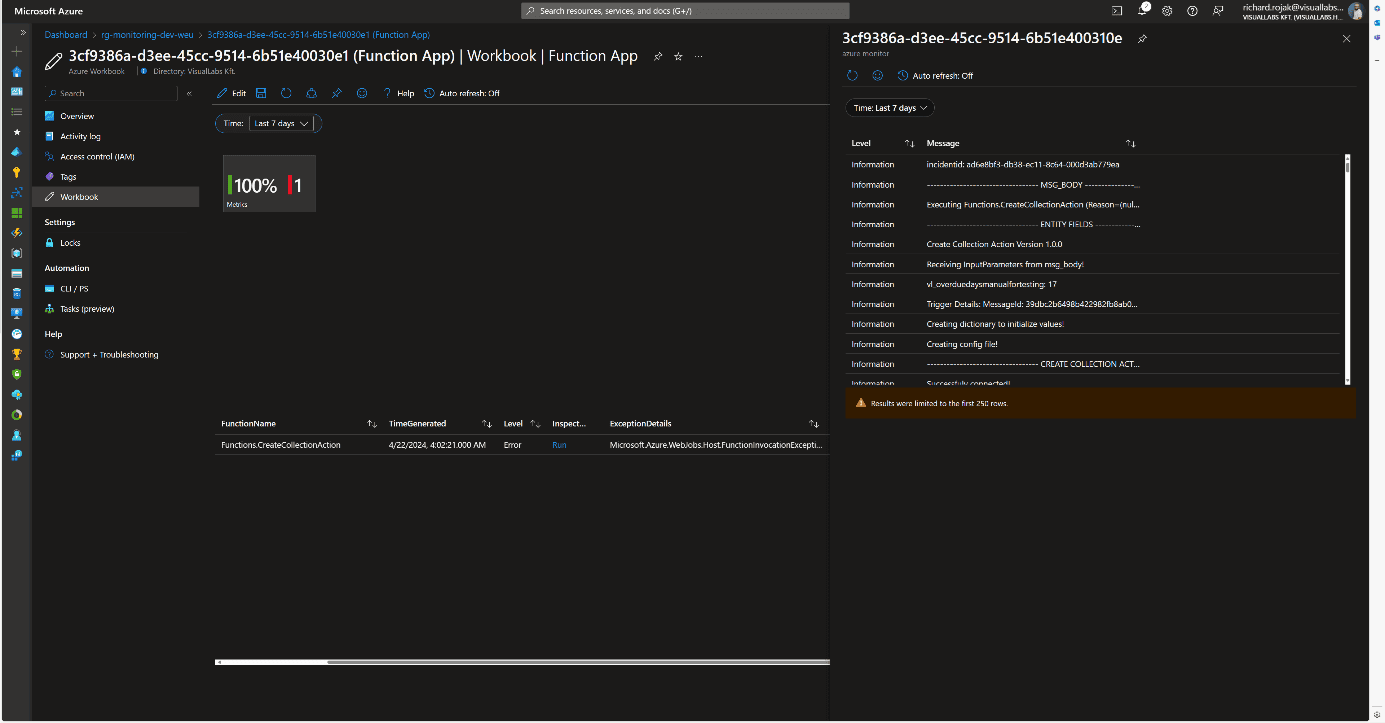
Azure Function
The structure is the same for Azure Functions, with the addition that the link redirects to another Workbook instead of the specific run’s Function App monitor page. This is necessary because only the last 20 runs can be reviewed on the Portal. For older runs, we need to use Log Analytics, so to facilitate error tracking, the unique logs determined by developers in the code for the faulty run are displayed in chronological order.
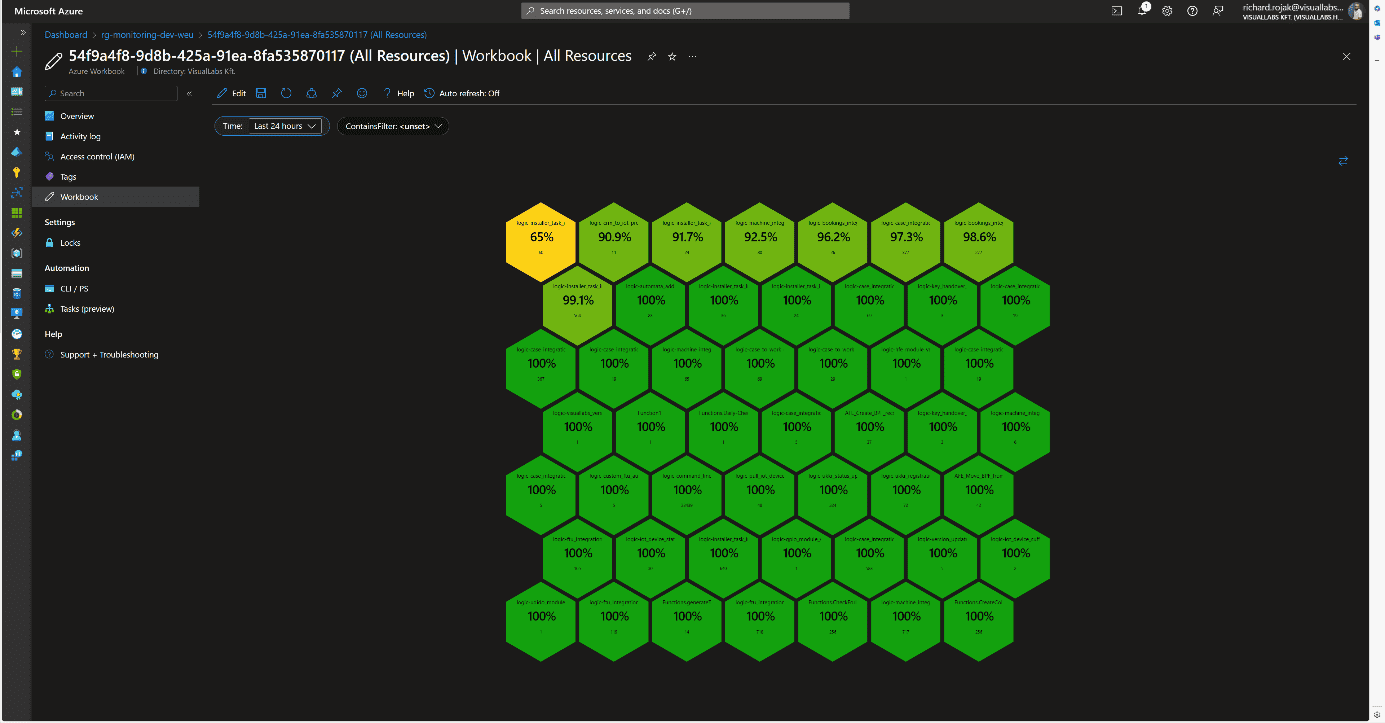
Consolidated View
Since organizationally, the same team may be responsible for multiple projects, a comprehensive view was also created where all resources are displayed without type-dependent grouping. This differs from the Workbook of a specific project’s resources in that the honeycombs are ordered by success rate, and the total number of runs is displayed. Clicking on the percentage value brings up the previously described resource type-specific views.
Usability
This solution can be handy in cases where we want to get a picture of the status of various platform services in a centralized location. This can be realized interactively for all runs, except for Flows, without switching tenants or possibly different user accounts. Notification rules can also be configured based on queries used in Workbooks.
Advantages:
- The monitoring system and visualization are flexible and customizable.
- New resources of the same type can be added with a few clicks to already defined resource types (see: configuring diagnostic settings for Logic Apps).
Disadvantages:
- Custom log tables, visualizations, and navigation between Workbooks require manual configuration.
- Integrating Flows requires significantly more time investment during development and planning.
- Combining tables, separating environments and projects can be cumbersome due to different infrastructure schemas.
- Basic knowledge of KQL (Kusto Query Language) or SQL is necessary for queries.
Experience
The team that implemented the solution for the client provided positive feedback. They use it regularly, significantly easing the daily work of developer colleagues and error tracking. Errors have often been detected and fixed before the client noticed them. It also serves well after the deployment of new developments and modifications. For Logic Apps, diagnostic settings are included in ARM (Azure Resource Manager) templates during development, so runs can be tracked from the moment of deployment in all environments using release pipelines.

Depending on the stage of a sales process, different functions should be available on a form's Subgrid. Practically, this means that at the beginning of the process, interests can be added to a Lead, but these should not be modifiable later in the Opportunity phase.This article requires some technical knowledge for understanding and application, so it is recommended for Dynamics 365 CE app makers who are already familiar with the Power Platform world.
Starting point:
Goal:
Tools Used for the Solution:
- JavaScript (Recommended: XRM toolbox – Web Resource Manager) - WebResources Manager · XrmToolBox
- Ribbon Workbench - Develop 1 Ltd | Ribbon Workbench for Dynamics 365 & Dynamics CRM
The Solution:
1. Solution
Create a Solution that will be loaded into the Ribbon Workbench. Add the entity whose SubGrid you want to modify into this solution. (Important: when adding the existing entity to the Solution, do not import any other elements). The name of the Solution should always be constructed based on the following logic: Ribbon_VL_[entity name] e.g., Ribbon_VL_Product_Interest.

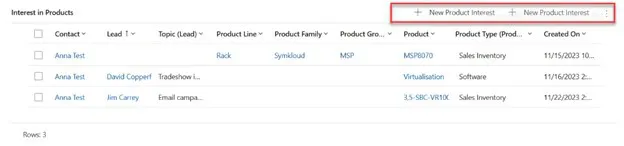
2. Subgrid
Name the SubGrid with a unique, identifiable name. Do not use the automatically generated name, as you will refer to this later.
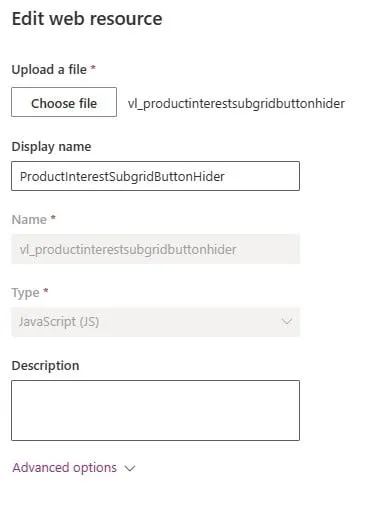
3. JavaScript
Create the following JavaScript as a .js file (using VS Code), then upload it to the solution containing the Web resources. It is advisable to name the file the same as its content to make it easier to find later.
forProductInterestView: function (selectedControl) {console.log("start.forProductInterestView");"use strict";debugger;var currentGridName = selectedControl._controlName;console.log("forProductInterestView-currentGridName: "+currentGridName);var excludedPayRun = "subgrid_prodinterest"; //Name of the subgridif (currentGridName == excludedPayRun) {console.log("end.forProductInterestView.true");return false;}else { console.log("end.forProductInterestView.false");return true; }}
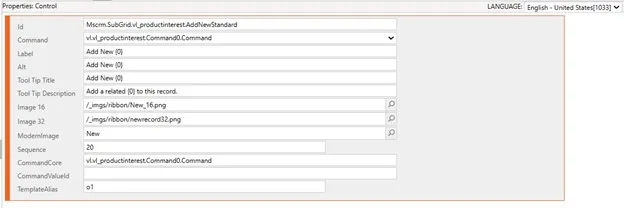
4. Ribbon Workbench
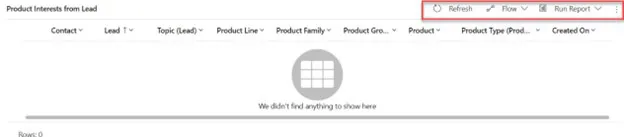
Open the Ribbon workbench and add the solution created in step one. Each entity has 3 ribbons: Home, Subgrid, Form. We now need the Subgrid.
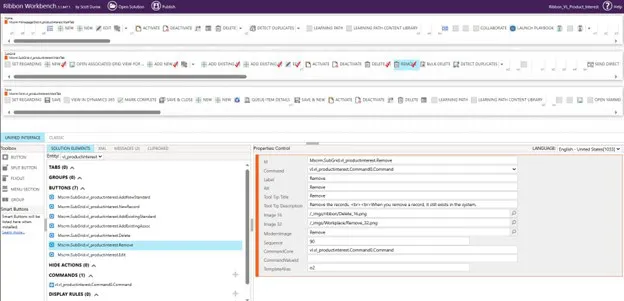
Select the button you want to remove by right-clicking on it and pressing "Customise Button." A red checkmark will appear, and it will also be added to the Buttons section below. If it is already checked, it means a command is already associated with it; in that case, you need to add a new command and can skip this step.
Next, add a Command, which can be done by clicking the plus sign in the Commands section. The command should look like this:
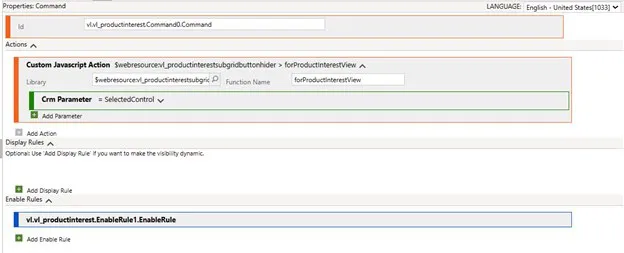
Explanation:
- Library: The webResource you added to the solution (this is where the good naming comes in)
- Function name: The name given in the JavaScript. (The part before the Function)
- CRM Parameter: What parameter to pass; in this case, it is the SelectedControl. This Control manages the SubGrids on Forms and all listings. The PrimaryControl manages the form.
Next, add an EnableRule that hides the buttons.
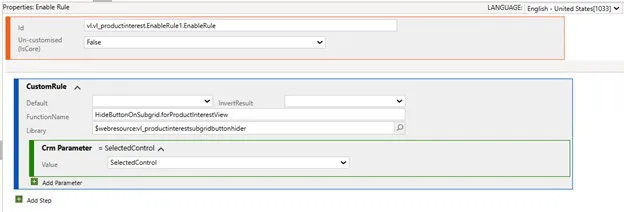
Explanation:
- Library: The webResource you added to the solution (this is where the good naming comes in)
- Function name: The name given in the JavaScript. (The part before the Function)
- CRM Parameter: What parameter to pass; in this case, it is the SelectedControl
Only one step remains before Publishing. For the buttons, specify which Command should be associated with them.
I hope you find this article useful and that it provides a solution idea.

When I started working at VisualLabs, during the first WSM (weekly standup meeting) where each business division reports on their current weekly tasks, I noticed how many abbreviations we use. As a member of the ERP team, I wondered if we know exactly how these abbreviations came about and what they stand for.
The term ERP (Enterprise Resource Planning) is familiar to everyone today, but few know its exact origins and development path. Therefore, I decided to gather information on where it started and the major milestones that helped shape the ERP systems we know today. Looking back in time, we will realize how deeply this technology is rooted in the modern business world.
In this blog, I have compiled seven milestones that contributed to the development of the ERP system as we know it today.
In today’s world, it would be unimaginable for a company not to use some kind of computer system for its various processes. However, before the advent of computers, companies had to manage these processes (be it accounting or production planning) using some methods. Take accounting, for example. Accountants recorded every financial transaction manually on paper in different books, which they managed daily and monthly. It is hard to imagine that companies often had rooms full of (main) books and files, each containing dozens of transactions. At the center of it all was the accountants’ most precious asset, the general ledger. It is daunting to think about how much work the year-end closing process entailed and how many errors could occur during this process.

- Birth of Computers (1950s):
In the 1950s, with the birth of computers – theoretically founded by John von Neumann – a new dimension opened up in the operation of companies and the transformation of their processes. Although these computers were primarily used in the military and scientific fields in the 50s – due to their large size and cost – continuous technological developments soon brought them into the business world. These devices allowed faster data processing and analysis and helped automate business activities.

2. Inventory Management and Control (1960s):
One of the first milestones in recognizing the potential of computers for business opportunities stretches back to the 1960s. The manufacturing industry realized the need for a system that would enable inventory management, monitoring, and control. The emergence of information technology allowed companies to integrate and automate their business processes. As a result, they improved the efficiency and accuracy of inventory management. This was one of the first steps toward developing ERP systems.
3. Material Requirements Planning (MRP I, 1970s)
The concept of MRP (Material Requirements Planning) first appeared in 1970 and fundamentally represented a software-based approach to planning and controlling manufacturing processes. MRP’s application primarily focused on planning and tracking material requirements. This approach allowed companies to predict more accurately the type and amount of materials needed during production processes. With MRP, companies could manage material procurement and production scheduling more effectively, reducing losses from over- or underestimation. This innovation had a significant impact on the manufacturing industry and fundamentally transformed companies’ material planning processes. This approach contributed to increased efficiency and competitiveness of manufacturing companies in the 1970s.
4. Manufacturing Resource Planning (MRP II, 1980s): The 1980s marked a significant milestone with the advent of MRP II systems. While MRP focused solely on the inventories and materials needed based on real or forecasted customer demands, MRP II provided greater insight into all other manufacturing resources. By extending manufacturing planning beyond materials to include labor, machinery, and other production resources, it gave companies much greater control over their manufacturing processes.
5. Enterprise Resource Planning Systems (ERP, 1990s): In the 1990s, the first true ERP systems were introduced. (The term ERP itself was coined by the research firm Gartner in the 1990s.) ERP systems represented a significant advancement compared to MRP II systems as they focused not only on manufacturing but also on the full integration and automation of business processes. Such processes included procurement, sales, finance, human resources, and accounting. With full integration, companies could manage their business processes in a unified database, offering numerous advantages. The unified storage and management of information ensured access to accurate, up-to-date data, improving decision-making and efficiency. The connected business areas helped formulate and implement unified strategies. As a result, the ERP system became a “one-stop solution” that managed all company information.
6. Web-Based Functionalities with the Rise of the Internet (ERP II, 2000s): In the mid-2000s, as the internet’s role grew in the business world, ERP systems also adapted to this change. Systems began incorporating customer relationship management (CRM) and supply chain management (SCM) functionalities. ERP II emphasized user-friendly interfaces and customization. Modular systems were developed, allowing businesses to select and implement the components most relevant to their operations.
7. Cloud-Based ERP (2010s): In the 2010s, the emergence of cloud technology added a new dimension to ERP systems. Cloud-based ERP solutions allowed companies to store and run their ERP systems in the cloud instead of traditional “on-premise” installations. This offered significant advantages, including greater flexibility, lower costs, and easier access to critical data. With cloud-based ERP systems, companies no longer had to worry about server maintenance or software updates, as these tasks were handled by their providers. This allowed companies to focus on their business goals and processes while ensuring their system was always up-to-date and accessible.
+1 The Future of ERP: So where is the development of ERP systems headed today? With intelligent algorithms and artificial intelligence, systems are increasingly able to automate and optimize business processes, reducing the need for human intervention. Data will continue to play a key role in the future, as more efficient analysis of data enables companies to make better business decisions. The integration of ERP systems with various IoT devices allows real-time data exchange, providing companies with quicker and more accurate answers to support different business questions.

ERP systems are also increasingly providing personalized user experiences and offering expandable integrations with other business applications and technologies. In the future, ERP systems will not just function as tools but will provide true business intelligence and competitiveness, helping companies keep pace with the rapidly changing business environment and stand out from their competitors.
Are you exploring the world of ERP systems? Visual Labs can help you uncover the possibilities within.
Sources:
https://www.geniuserp.com/resources/blog/a-brief-history-of-erps https://www.fortunetechnologyllc.com/history-of-erp-systems/ https://www.geniuserp.com/resources/blog/a-brief-history-of-erps
https://www.erp-information.com/history-of-erp.html#google_vignette https://www.techtarget.com/searcherp/tip/MRP-vs-MRP-II-Learn-the-differences https://www.business-case-analysis.com/account.html https://www.britannica.com/technology/computer/IBM-develops-FORTRAN https://business.joellemena.com/business/when-did-computers-start-being-used-in-business-2/

Power Pages
Digital presence is becoming increasingly important for every business. To stay competitive, we need to quickly adapt to changing demands and technological advancements. Therefore, it is essential to use tools that allow us to efficiently and quickly create websites that meet our business goals.
Power Pages, previously known as Microsoft Power Apps Portals, is a platform that allows us to build websites quickly and easily while seamlessly integrating them with our existing data sources. Power Pages is an ideal solution for businesses that want to create websites swiftly without lengthy development times.
For example, we used Power Pages for the Construction Monitoring and Data Service System’s portals, which greatly assists clients in recording, tracking, and administering their inquiries.
Power Pages also played a crucial role in an IT audit project, enabling us to efficiently handle data provision from multiple companies.
Collecting and managing data services is one of the most critical phases of audit projects, especially when involving multiple companies. Power Pages proved to be an extremely useful tool in this process, where we had to request data from numerous companies and then collect and manage this information through the platform. The platform allowed the creation of websites in a simple and intuitive manner without requiring complex coding knowledge.
Firstly, with Power Pages, we easily created a user-friendly interface that enabled companies to submit their data services efficiently. The interface featured simple data entry forms, making it easy for companies to understand how to input information into our system.
Secondly, Power Pages allowed for easy management and tracking of data throughout the project. The transparent administration interface helped us keep track of which companies had submitted their data and the status of the data collection process. This allowed us to respond efficiently to any shortcomings or questions from the companies.
Thirdly, Power Pages facilitated the easy integration and analysis of data within the audit project. The collected data could be easily imported into other systems (e.g., Power BI), making it readily usable in the audit process. This enabled us to analyze and evaluate the information submitted by companies more quickly and efficiently.
Overall, Power Pages offers a scalable solution, flexible and customizable, adapting to unique business needs and requirements. This allows businesses to freely shape and expand their websites according to their business goals.
One of our clients had a need for such a website.
The Sales Portal we created for one of our clients is a website that enables external sales partners or distributors to collaborate on sales opportunities and increase sales within the organization. This site provides state-of-the-art, secure authentication and fully customizable design and functionality. Distributors can log in and collaborate on sales opportunities in full sync with internal sales teams, thanks to instant two-way data synchronization. The marketing department can assist in the sales process by updating sales guides and materials available on the homepage, keeping the latest product information up-to-date.
If you also want to create websites quickly and efficiently for your business, it might be worth trying out Power Pages. The Visual Labs team is happy to assist you with this!
Deming's System of Profound Knowledge - IT Revolution
What is the book about?
This book covers the life of W. Edwards Deming who founded modern managerial statistics and contributed greatly to WWII production effort in the US and post-war recovery on Japanese manufacturing.
This book is not merely a biography; it intertwines Deming's life story with the evolution of management history, providing a comprehensive view of his impact.
As the book was published by IT revolution and written by the co-author of the DevOps Handbook, it talks in detail about how agile methodologies.
What I found useful?
It was truly insightful to see the lineage of how different managerial waves evolved in the past hundred years, how the different management methods succeeded each other (from Total Quality Management through Lean and then how the foundations permeated into Agile and later to DevOps). The author paints a great picture of the events and the people involved besides Deming.
The first half of the book talks about the evolution of modern manufacturing processes through the life of Deming, I feel this is the part of the book that was fairly novel. This part of the book also flows really, it could easily be a narration of a Netflix documentary.
The second half of the book turns to software development and mainly to the DevOps 'movement', this part is definitely insightful, draws on several interesting case studies especially in the IT Security area. (e.g. white hat vs. black hat hackers).
Who would I recommend it to?
Certainly an interesting read (listen) to those interested in management history and the ideological background of the current software delivery practices.
If you are new to this sort of literature and domain (e.g. manufacturing, lean, software development practices), this may not be an ideal starting point as it talks about concepts fairly briefly assuming that readers are already familiar with them - which is what you would expect from the typical reader (listener) of this book.
Follow-on
For further reading, deep-dive, it'd be interesting to read first-hand from Dr. Deming: "The culmination of his knowledge" was compiled into what is called "System of Profound Knowledge" along with this famous "14 Points for Management"
Dr. Deming's 14 Points for Management - The W. Edwards Deming Institute
The Deming System of Profound Knowledge® (SoPK) - The W. Edwards Deming Institute
