Monitoring Standardization: using Workbooks for Logic Apps, Azure Functions and Microsoft Flows

Richard Rojak

Problem Statement
Monitoring of the three platforms mentioned in the title is solved independently in different locations. Logic Apps can be monitored either from the resource’s run history page or through the Logic App Management solution deployed to a Log Analytics workspace. Azure Functions have Application Insights, while the run history of Microsoft Flows is available on the Power Platform.Most of our clients’ solutions consist of these resources, which often chain together and call each other to represent business processes and automations. Their centralized supervision is not solved, making error tracking and analysis difficult for employees. Moreover, they had to log into the client’s environment to perform these tasks.
Goal
We wanted to get a general overview of the status of the solutions we deliver to our clients, reduce our response time, and proactively prevent error reports submitted by our clients. We aimed to track our deployments in real-time, providing a more stable system and a more convenient user experience. We wanted to make our monitoring solution available within Visuallabs so that we could carry out monitoring tasks from the tenant that hosts our daily development activities.
Solution
Infrastructure Separation
Our solution is built on the infrastructure of a client used as a test subject, whose structure can be considered a prerequisite. On the Azure side, separate subscriptions were created for each project and environment, while for Dynamics, only separate environments were used. Project-based distinction for Flows is solved based on naming conventions, and since log collection is manual, the target workspace can be freely configured.
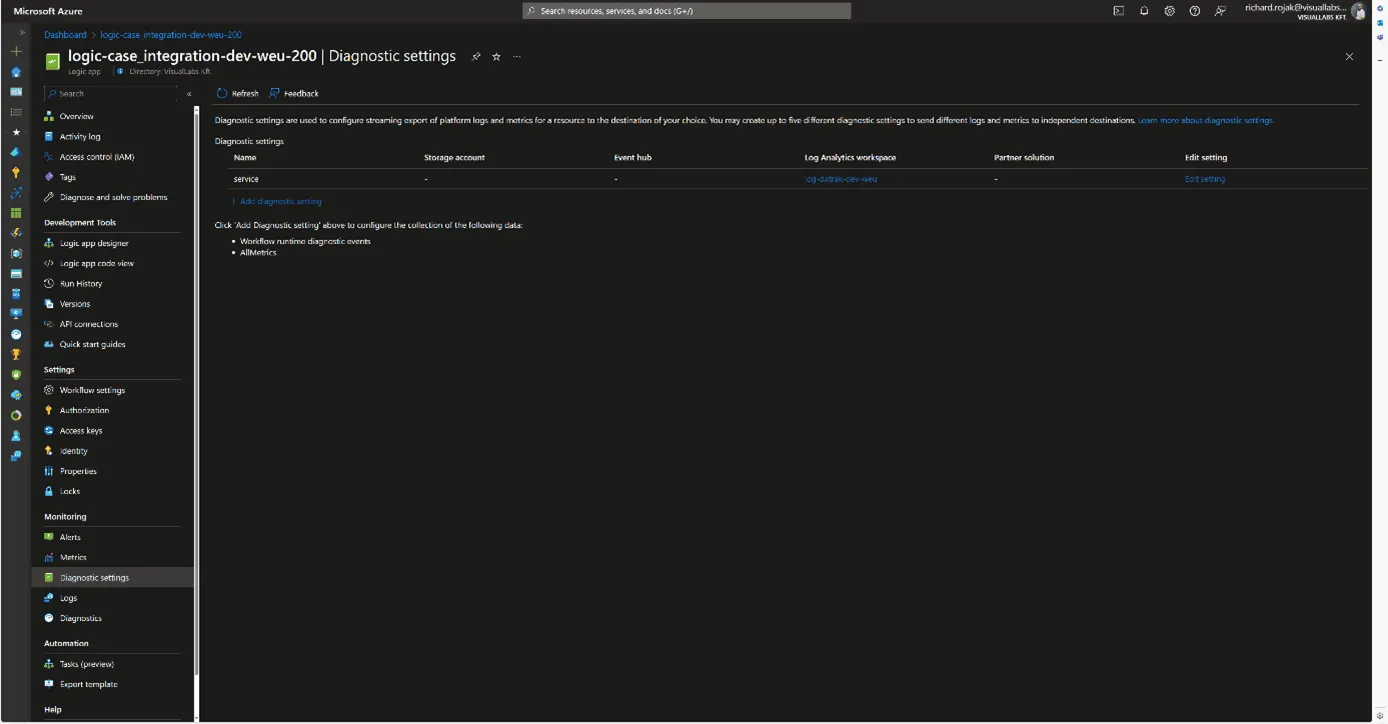
Centralized Log Collection
It was obvious to use Azure Monitor with Log Analytics workspaces for log collection. Diagnostic settings were configured for all Azure resources, allowing us to send logs to a Log Analytics workspace dedicated to the specific project and environment. For Microsoft Flows, we forward logs to a custom monitor table created for Flows using the built-in Azure Log Analytics Data Collector connector data-sending step. This table was created to match the built-in structure of the Logic Apps log table, facilitating the later merging of the tables.


Making Logs Accessible in Our Tenant
An important criterion for the solution was that we did not want to move the logs; they would still be stored in the client’s tenant; we only wanted to read/query them. To achieve this, we used Azure Lighthouse, which allows a role to be enforced in a delegated scope. In our case, we set up a Monitoring contributor role for the client’s Azure subscriptions for a security group created in our tenant. This way, we can list, open, and view resources and make queries on Log Analytics workspaces under the role’s scope from our tenant.
Visualization
For visualization, we used Azure Monitor Workbook, which allows data analysis and visual report creation, as well as combining logs, metrics, texts, and embedding parameters. All Log Analytics workspaces we have read access to via Lighthouse can be selected as data sources. Numerous visualizations are available for data representation; we primarily used graphs, specifically honeycomb charts, but these can easily be converted into tables or diagrams.

Combining, Customizing, and Filtering Tables
To process log tables from different resources together, we defined the columns that would be globally interpretable for all resource types and necessary for grouping and filtering.These include:
- Client/Tenant ID
- Environment/Subscription ID
- Resource ID/Resource Name
- Total number of runs
- Number of successful runs
- Number of failed runs
Based on these, we could later determine the client, environment, project, resource, and its numerical success rate, as well as the URLs needed for references. These formed the basis for combining tables from various Log Analytics Workspaces and resources for our visualizations.

User Interface and Navigation
When designing the user interface, we focused on functionality and design. Our goal was to create a visually clear, well-interpreted, interactive solution suitable for error tracking. Workbooks allow embedding links and parameterizing queries, enabling interactivity and interoperability between different Workbooks. Utilizing this, we defined the following levels/types of pages:
- Client
- Project
- Resources
- Logic App
- Azure Function
- Flow

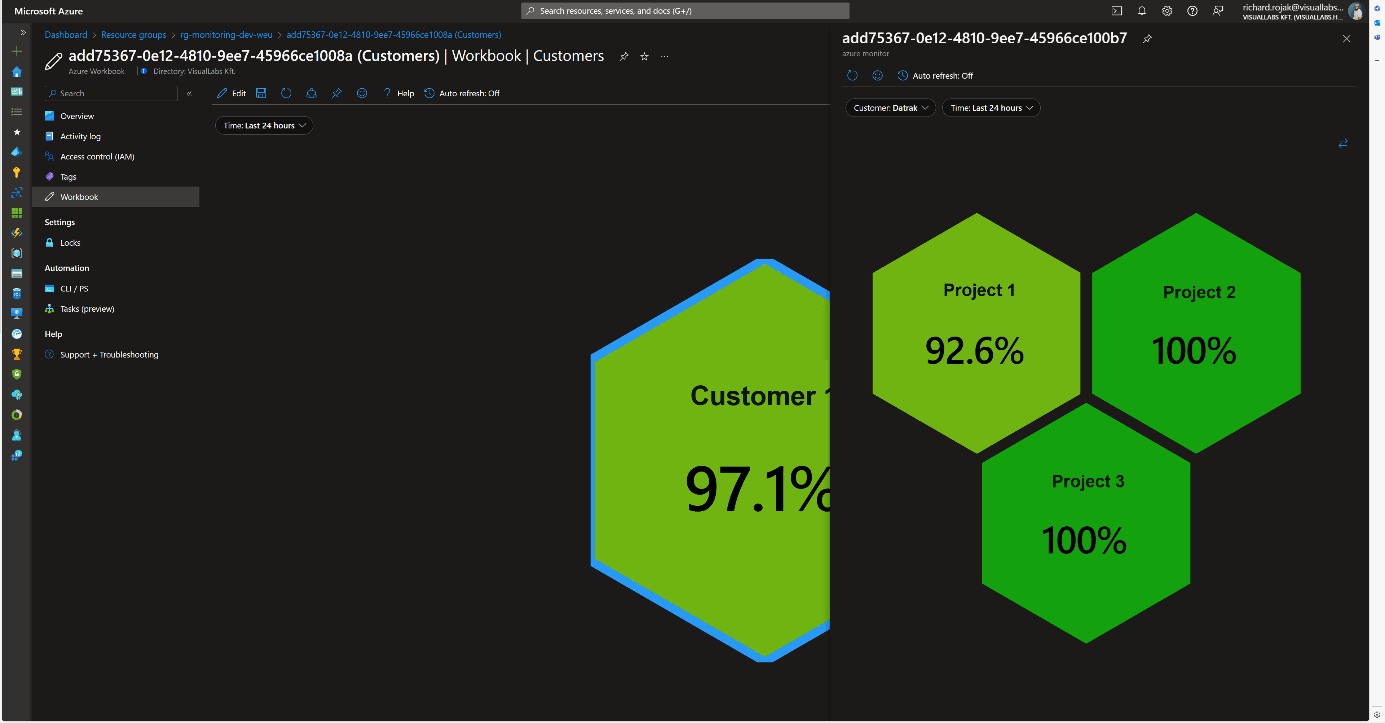
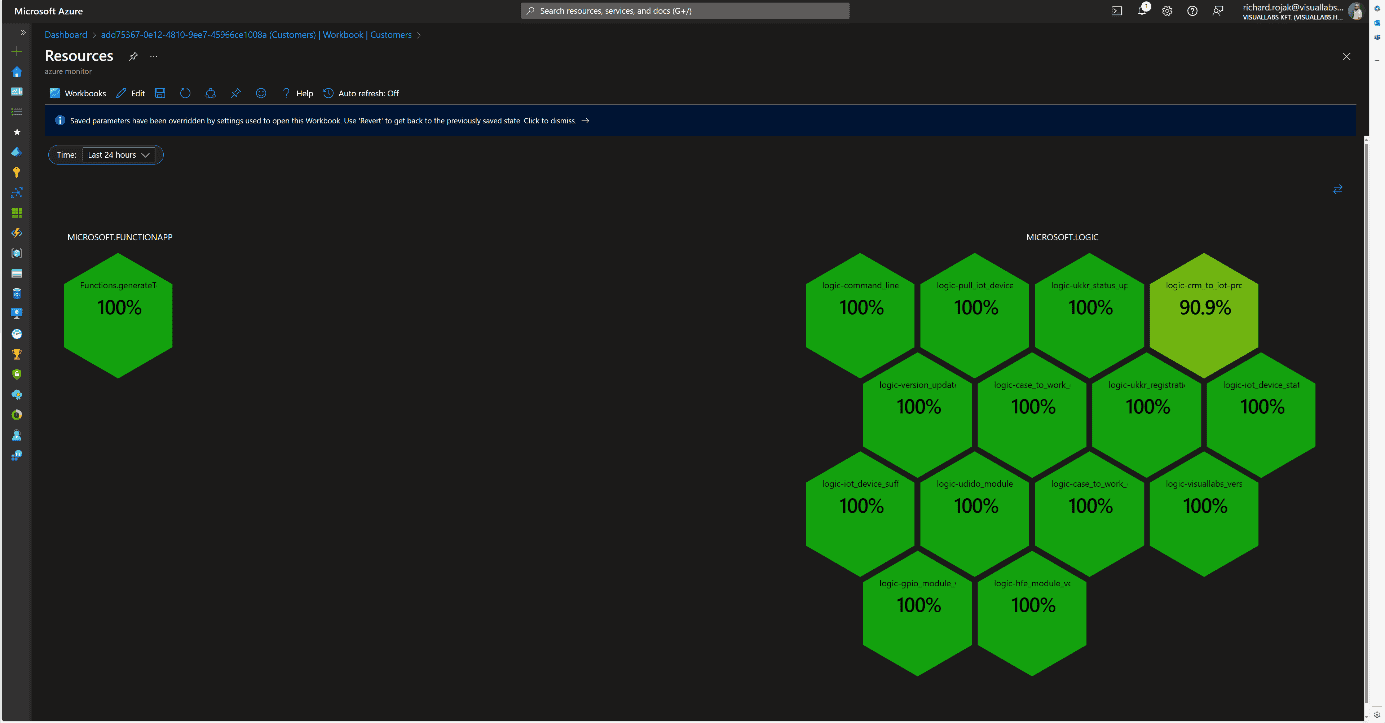

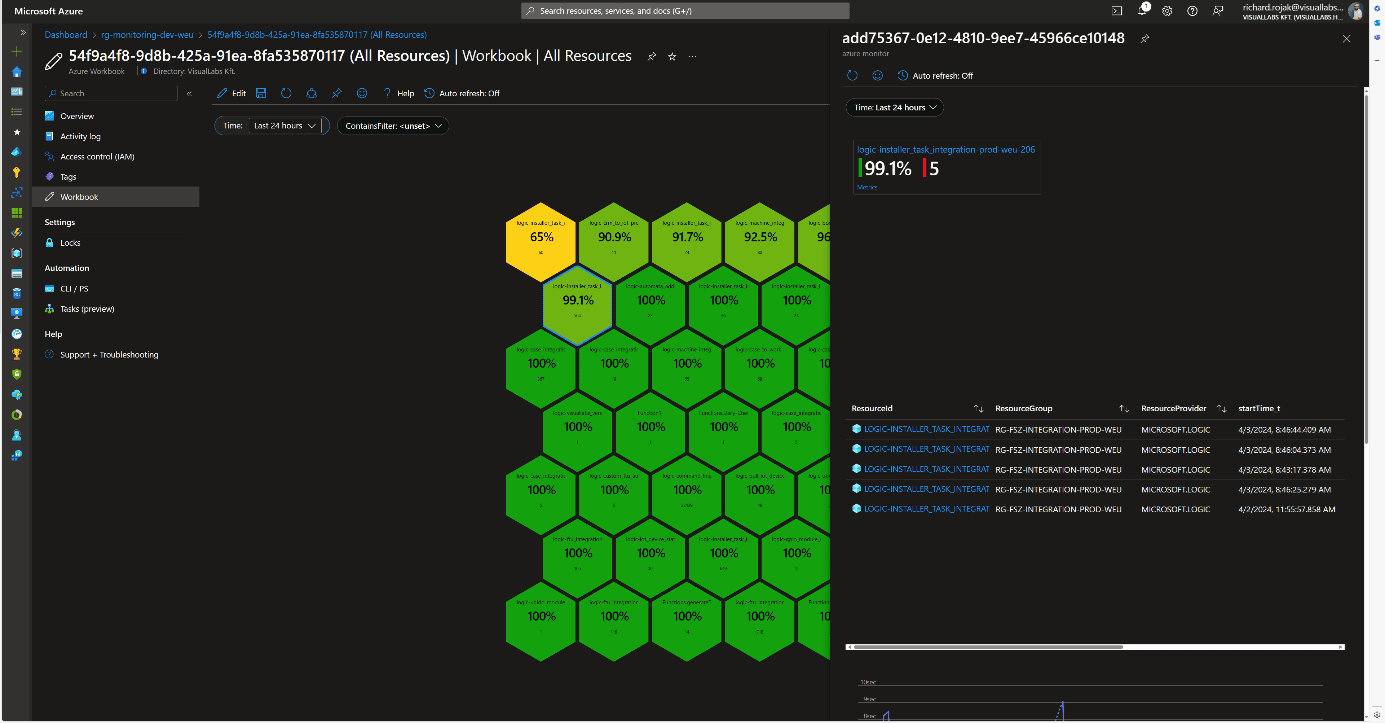
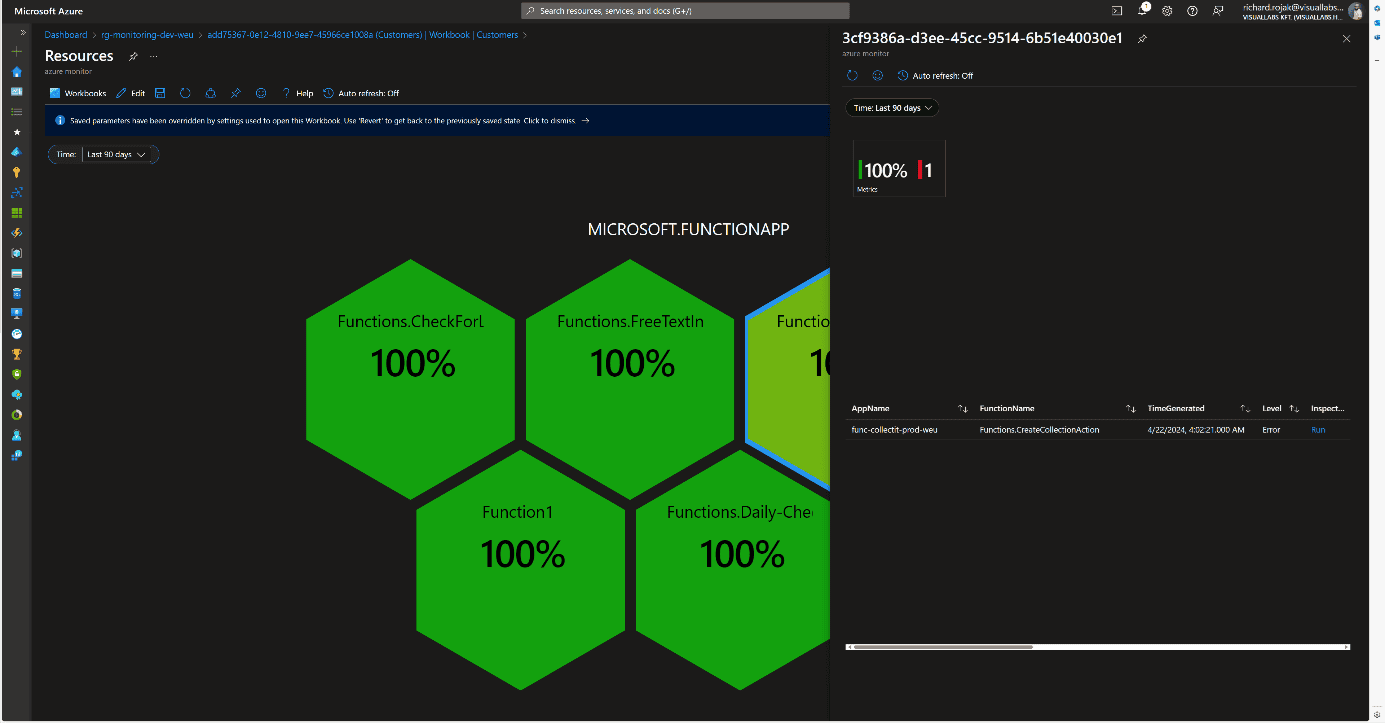
Resources [Azure Function] At the Client and Project levels, clicking on their names displays the next subordinate Workbook in either docked or full-window view, passing the appropriate filtering parameters. Time is passed as a global parameter during page navigation, but it can be modified and passed deeply on individual pages. We can filter runs retrospectively by a specific minute, hour, day, or even between two dates.On the page displaying resources, we provide multiple interactions for users. Clicking on resource names navigates to the resource’s summary page on the Azure Portal within the tenant, thanks to Lighthouse, without tenant switching (except for Power Automate Flows).Clicking on the percentage value provides a deeper insight into the resource’s run history and errors in docked view. This detailed view is resource type-specific, meaning each of the three resources we segregated has its own Workbook. We always display what percentage of all runs were successful and how many faulty runs occurred, with details of these runs.
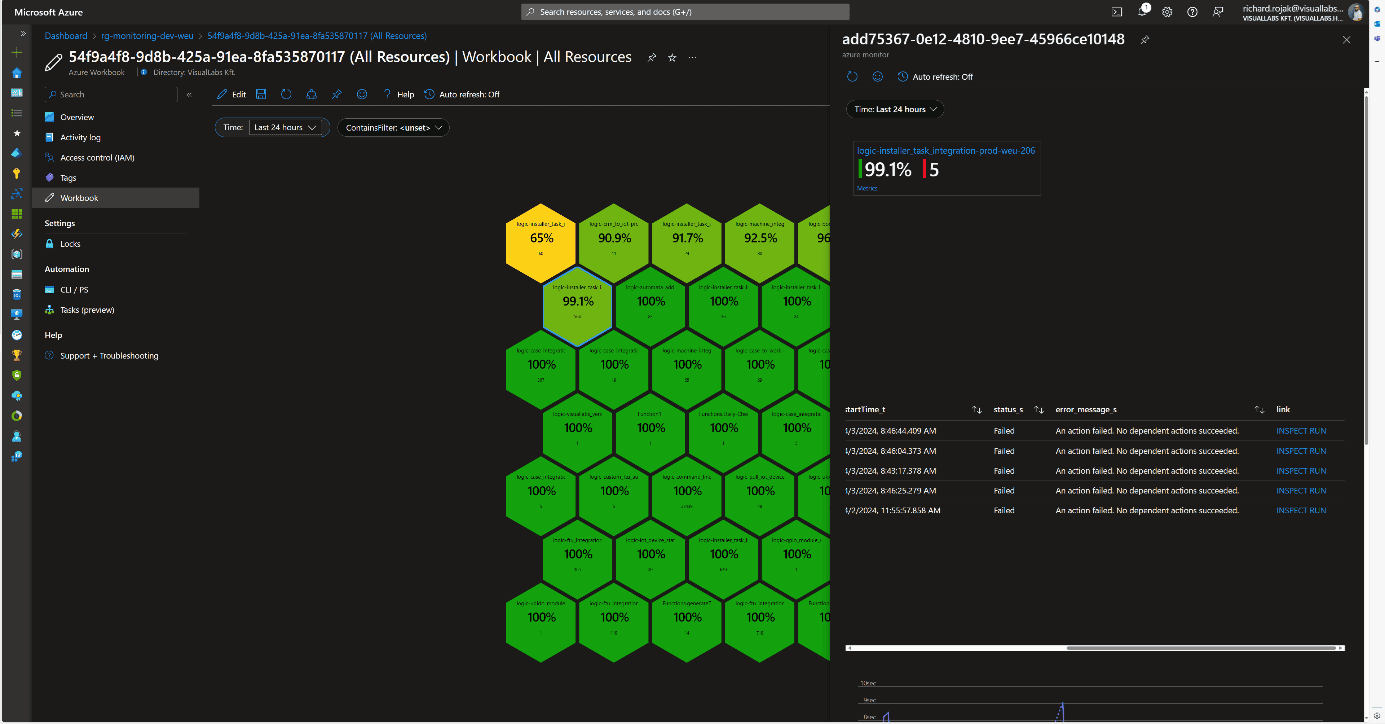
Logic App
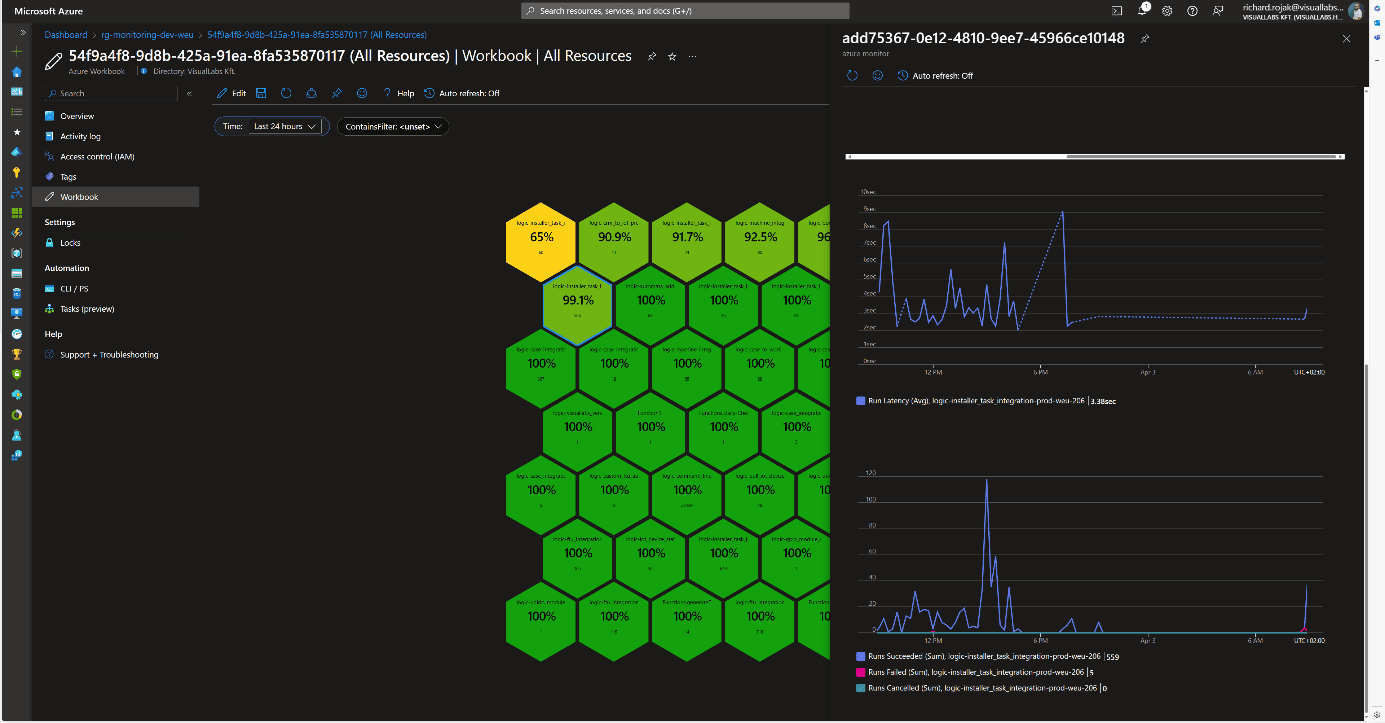
Beyond general information, faulty runs (status, error cause, run time) are displayed in tabular form if any occurred during the specified time interval. Clicking the INSPECT RUN link redirects the user to the specific run where all successful and failed steps in the process can be viewed. At the bottom, the average run time and the distribution of runs are displayed in diagram form.
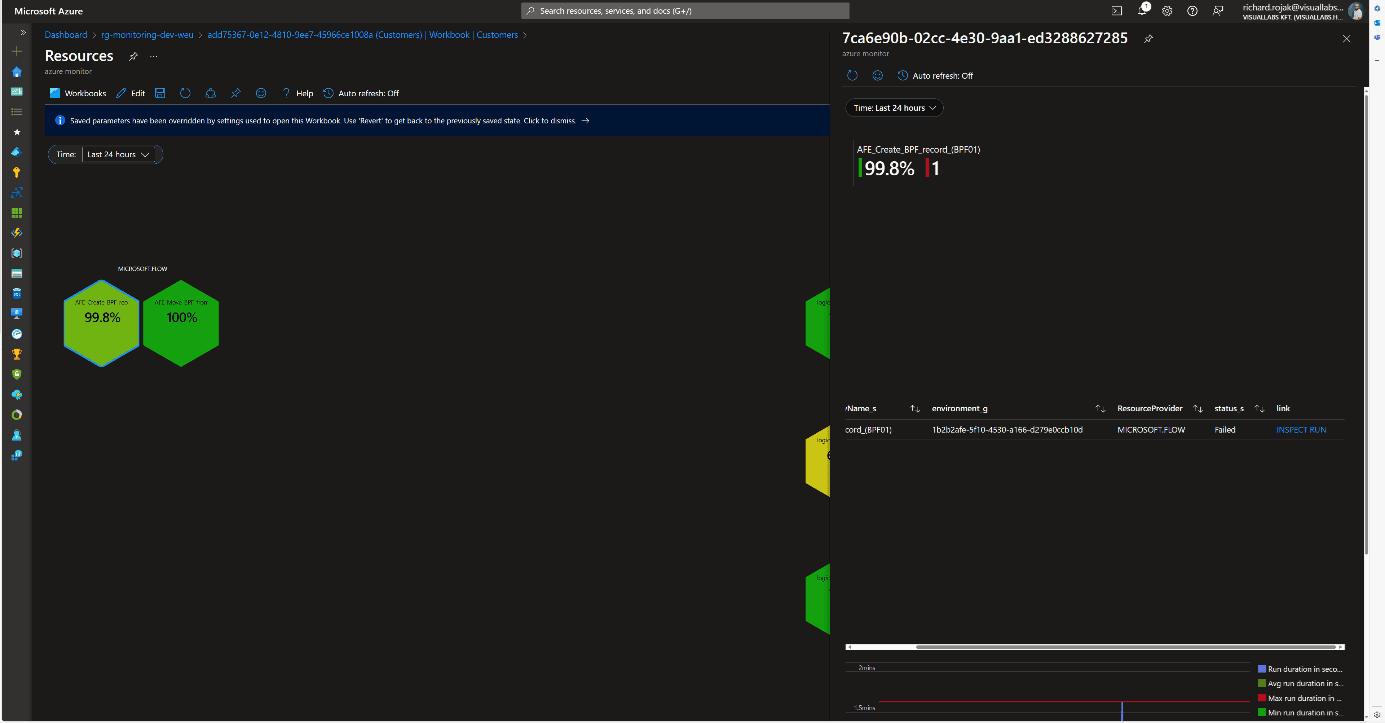
Microsoft Flow
For Flows, the same information as for Logic Apps is displayed. The link also redirects to the specific run, but since it involves leaving Azure, logging in again is required because Dynamics falls outside the scope of Lighthouse.
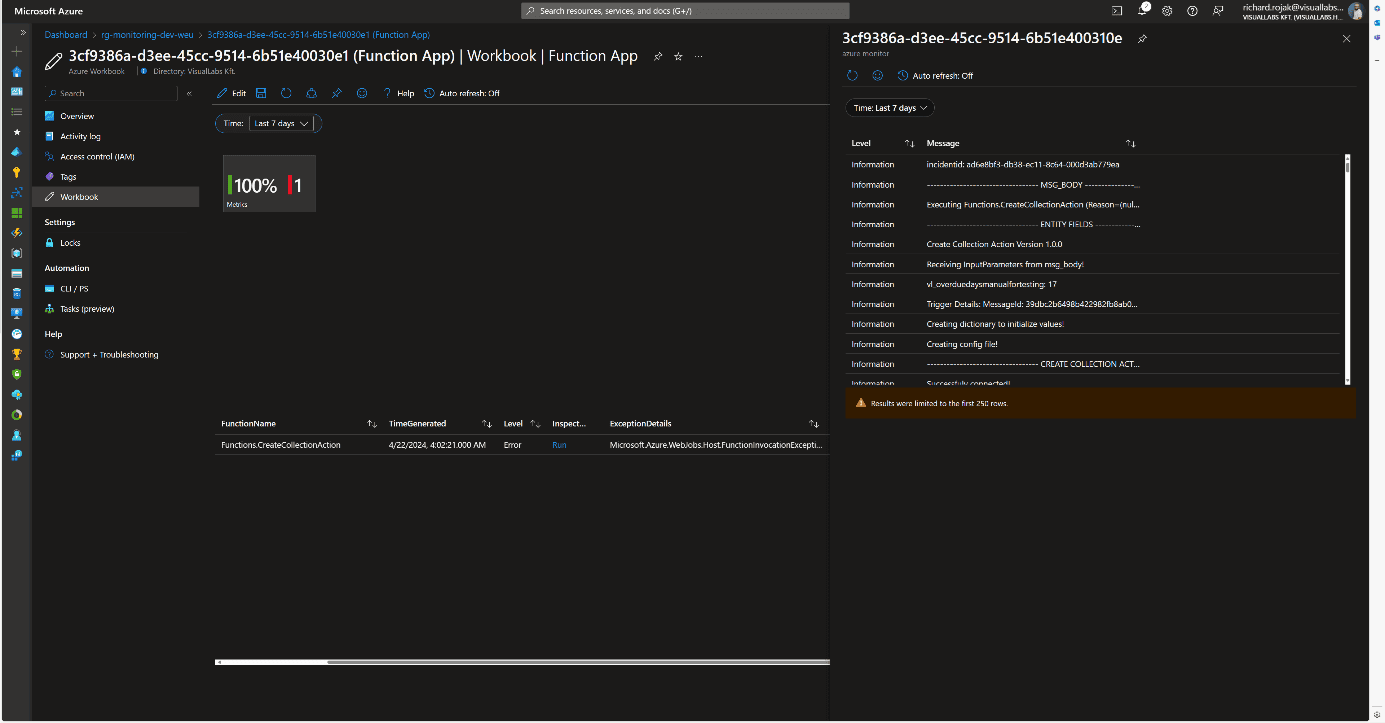
Azure Function
The structure is the same for Azure Functions, with the addition that the link redirects to another Workbook instead of the specific run’s Function App monitor page. This is necessary because only the last 20 runs can be reviewed on the Portal. For older runs, we need to use Log Analytics, so to facilitate error tracking, the unique logs determined by developers in the code for the faulty run are displayed in chronological order.
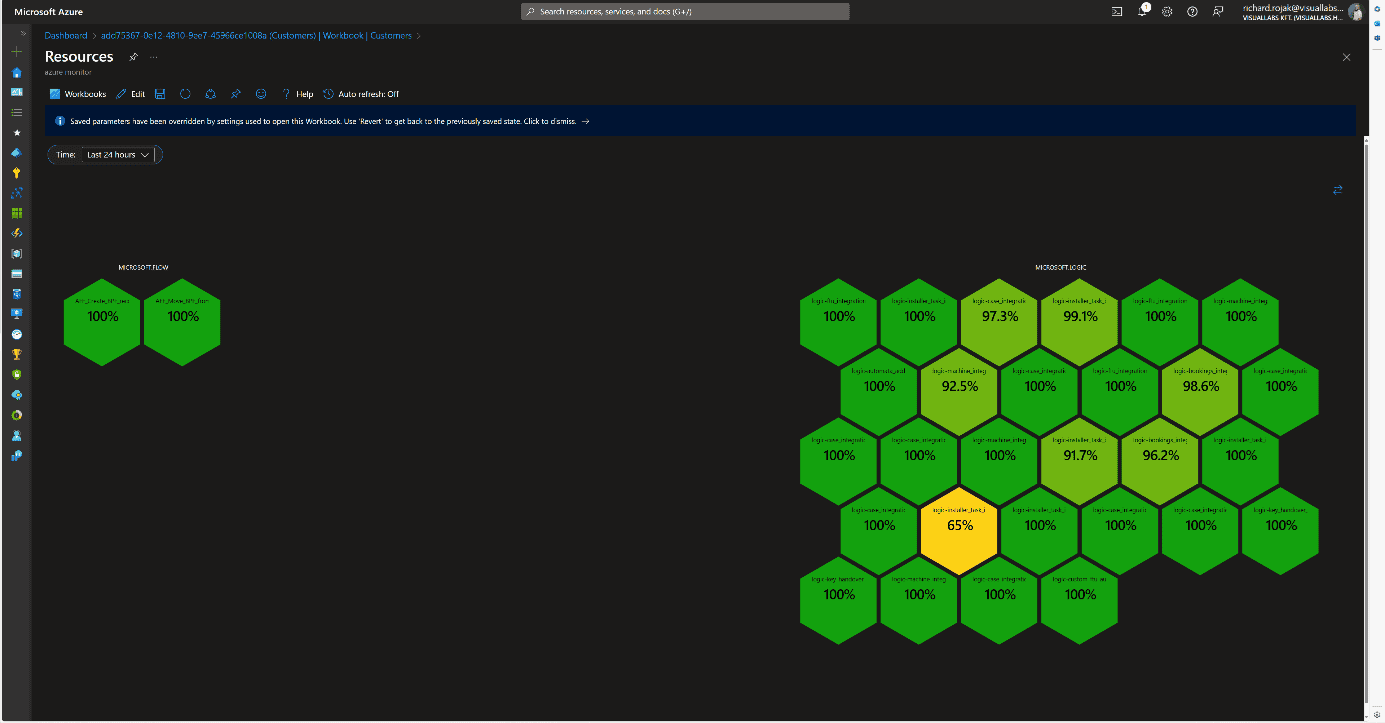
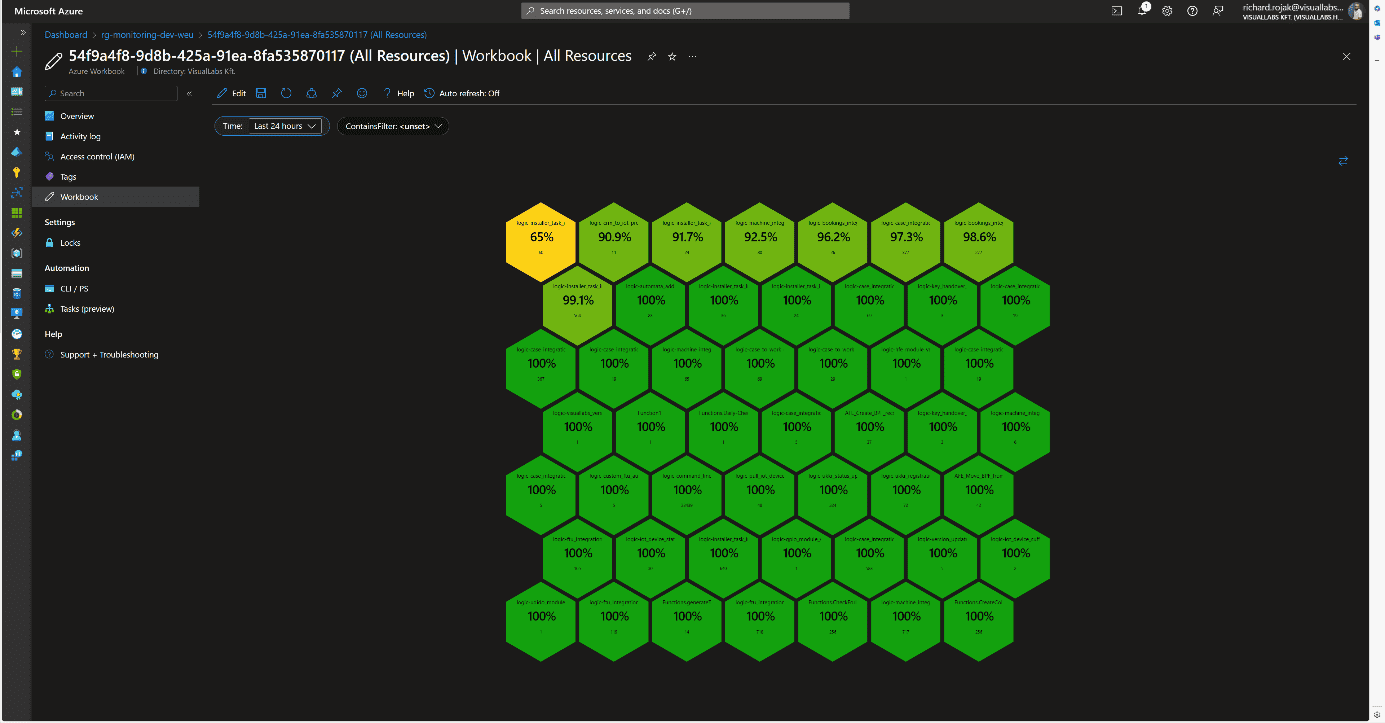
Consolidated View
Since organizationally, the same team may be responsible for multiple projects, a comprehensive view was also created where all resources are displayed without type-dependent grouping. This differs from the Workbook of a specific project’s resources in that the honeycombs are ordered by success rate, and the total number of runs is displayed. Clicking on the percentage value brings up the previously described resource type-specific views.
Usability
This solution can be handy in cases where we want to get a picture of the status of various platform services in a centralized location. This can be realized interactively for all runs, except for Flows, without switching tenants or possibly different user accounts. Notification rules can also be configured based on queries used in Workbooks.
Advantages:
- The monitoring system and visualization are flexible and customizable.
- New resources of the same type can be added with a few clicks to already defined resource types (see: configuring diagnostic settings for Logic Apps).
Disadvantages:
- Custom log tables, visualizations, and navigation between Workbooks require manual configuration.
- Integrating Flows requires significantly more time investment during development and planning.
- Combining tables, separating environments and projects can be cumbersome due to different infrastructure schemas.
- Basic knowledge of KQL (Kusto Query Language) or SQL is necessary for queries.
Experience
The team that implemented the solution for the client provided positive feedback. They use it regularly, significantly easing the daily work of developer colleagues and error tracking. Errors have often been detected and fixed before the client noticed them. It also serves well after the deployment of new developments and modifications. For Logic Apps, diagnostic settings are included in ARM (Azure Resource Manager) templates during development, so runs can be tracked from the moment of deployment in all environments using release pipelines.
Blog posts
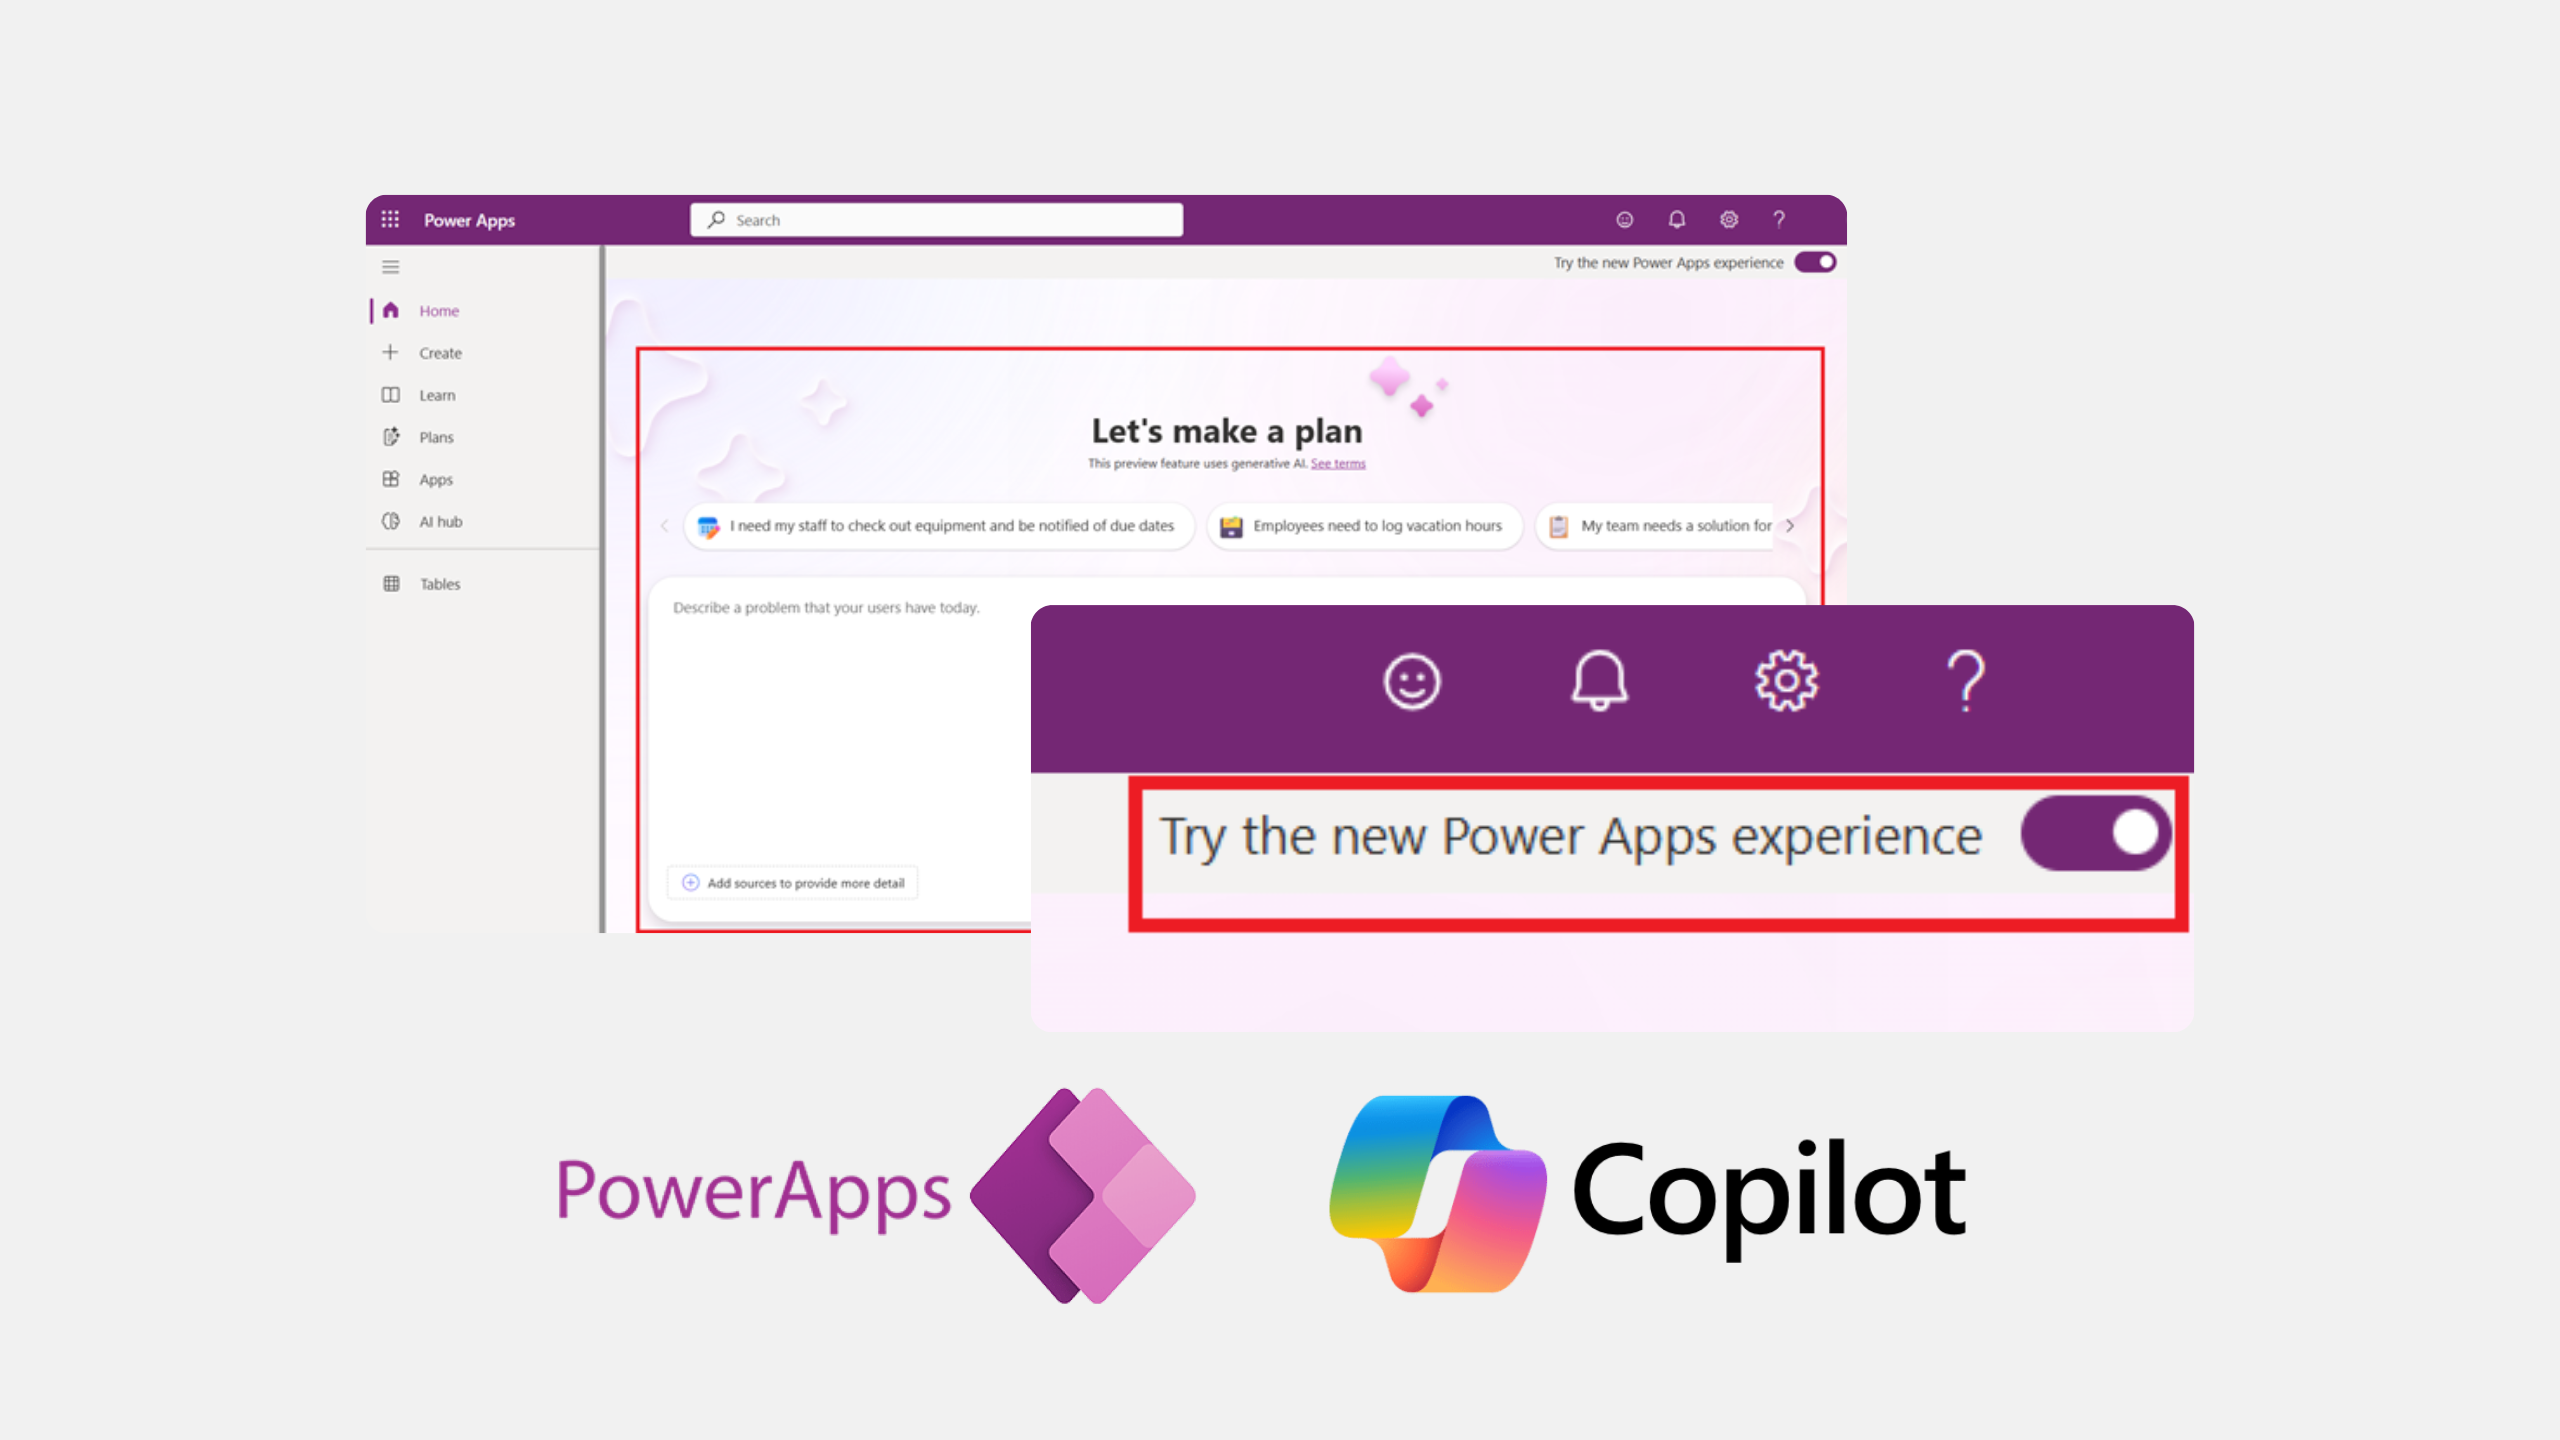
There's a new way to turn business ideas into app frameworks
Heading 1
Heading 2
Heading 3
Heading 4
Heading 5
Heading 6
Lorem ipsum dolor sit amet, consectetur adipiscing elit, sed do eiusmod tempor incididunt ut labore et dolore magna aliqua. Ut enim ad minim veniam, quis nostrud exercitation ullamco laboris nisi ut aliquip ex ea commodo consequat. Duis aute irure dolor in reprehenderit in voluptate velit esse cillum dolore eu fugiat nulla pariatur.
Block quote
Ordered list
- Item 1
- Item 2
- Item 3
Unordered list
- Item A
- Item B
- Item C
Bold text
Emphasis
Superscript
Subscript

The past, present and future of ERP systems
Heading 1
Heading 2
Heading 3
Heading 4
Heading 5
Heading 6
Lorem ipsum dolor sit amet, consectetur adipiscing elit, sed do eiusmod tempor incididunt ut labore et dolore magna aliqua. Ut enim ad minim veniam, quis nostrud exercitation ullamco laboris nisi ut aliquip ex ea commodo consequat. Duis aute irure dolor in reprehenderit in voluptate velit esse cillum dolore eu fugiat nulla pariatur.
Block quote
Ordered list
- Item 1
- Item 2
- Item 3
Unordered list
- Item A
- Item B
- Item C
Bold text
Emphasis
Superscript
Subscript
Ready to talk about your use cases?
Request your free audit by filling out this form. Our team will get back to you to discuss how we can support you.
